What a yield curve inversion means for stocks, bonds, and recession risk
In the world of investing, few signals draw as much attention—or anxiety—as an inverted yield curve. This quirky phenomenon, when short-term interest rates rise above long-term rates, has a history of predicting downturns. If you’ve heard headlines in 2025 talking about yield curve inversions and wondered what the fuss is about, you’re in the right place. In this guide, we’ll unpack what a yield curve is, why inversion matters, how it can impact your stocks and bonds, and what it’s saying about recession risk today.
🔔 Don’t miss out!
Add winvestacrisps@substack.com to your email list so our updates never land in spam
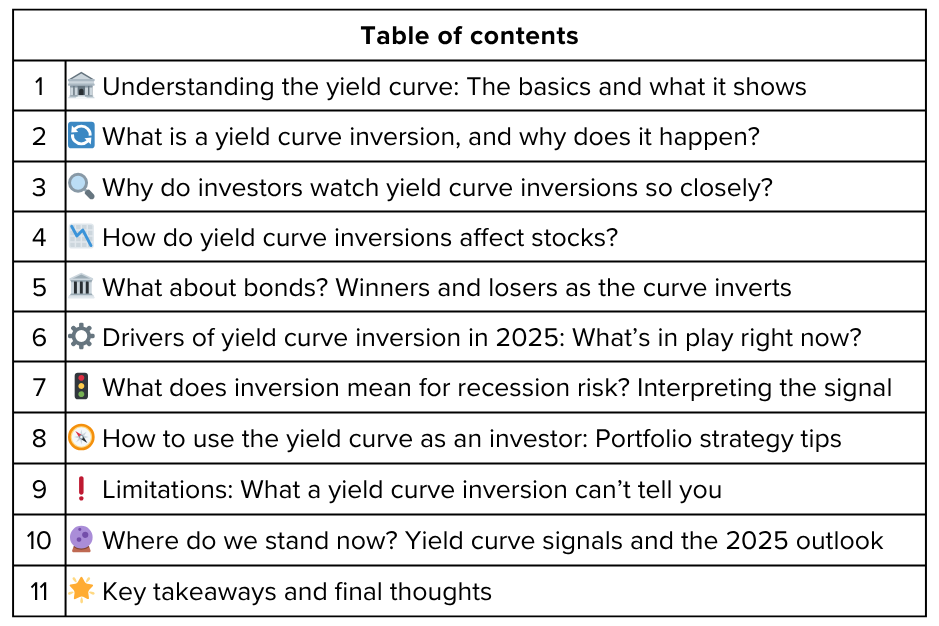
Understanding the yield curve: The basics and what it shows 🏦
The yield curve is a graph that plots the interest rates (yields) of bonds, most commonly U.S. Treasuries, with different maturities, from short (like 2 years) to long (like 10 or 30 years). Normally, the curve slopes upward, investors expect higher returns for tying up their money longer.
Normal yield curve: Long-term bonds yield more than short-term ones.
Flat yield curve: Yields across different maturities are similar, signaling uncertainty.
Inverted yield curve: Short-term rates rise above long-term rates.
This shape reflects investor expectations about inflation, economic growth, and central bank policy.
What is a yield curve inversion, and why does it happen? 🔄
A yield curve inversion happens when the interest rates on short-term government bonds are higher than those on long-term bonds. For example, if the two-year Treasury pays 4.5% and the ten-year pays only 4.0%, that’s an inversion.
Why does this happen?
Central banks, like the Fed, raise short-term rates to fight inflation.
Investors expect slower growth or a recession, so they rush to buy long-term bonds for safety, driving up their price and pushing down their yield.
An inversion signals that markets believe current policy may be too restrictive and a slowdown, or recession, could be on the horizon.
Why do investors watch yield curve inversions so closely? 🔍
Historically, extended yield curve inversions—particularly the 2-year vs. 10-year spread—have preceded nearly every modern U.S. recession by 12–18 months. While not a guarantee, this indicator has been right much more often than it’s been wrong.
Key points for investors:
Inversions flash warnings about credit conditions, corporate borrowing, and future growth.
Prolonged or deep inversions suggest a significant risk of economic contraction.
How do yield curve inversions affect stocks? 📉
Short-term: The immediate market reaction can be mixed; stocks may drift up or even rally if investors believe the Fed will soon cut rates.
Medium/Long-term: Historically, after inversion, stock markets often continue to rise—but within 12–18 months, they tend to peak and volatility increases.
Sectors: Defensive sectors (consumer staples, healthcare, utilities) and high-quality dividend stocks often outperform as recession risks rise. Cyclical stocks, small caps, and speculative tech/frothy growth stocks face headwinds.
Earnings: Companies sensitive to borrowing costs and consumer demand can suffer as credit tightens and spending slows.
Remember: the yield curve is a warning, not the sole cause of a downturn. Markets may ignore it for many months.
What about bonds? Winners and losers as the curve inverts 🏛️
Short-term bonds: Yields can be attractive when the curve inverts, offering more income with less duration risk.
Long-term bonds: Prices may rise (yields fall) as investors seek safety, but if inversion persists, returns can flatten out.
Riskier bonds: Tightening monetary policy and slower growth make investors less willing to take risk—spreads can widen, causing riskier bonds to underperform.
For income investors, shifting some exposure to short-dated Treasuries or high-grade corporates during inversions can be a smart move.
Drivers of yield curve inversion in 2025: What’s in play right now? ⚙️
In 2025, key forces contributing to yield curve inversion include:
Central bank policy: The Fed and many global counterparts raised rates aggressively in 2023–2024 to cool inflation, pushing up short-term borrowing costs.
Economic growth forecasts: Markets anticipate slower growth or an outright recession as post-pandemic booms fade.
Inflation expectations: While inflation has cooled, the risk of a renewed flare-up means the Fed remains cautious, keeping short-term rates elevated.
Market psychology: Demand for safety remains high amid political uncertainty, trade disputes, and unpredictable headlines.
What does inversion mean for recession risk? Interpreting the signal 🚦
The yield curve isn’t magic, but its track record is remarkable: every U.S. recession since 1970 was preceded by an inverted curve, though not every inversion led to recession.
Timing: Recessions usually hit 12–24 months after a sustained inversion begins.
False alarms: Brief, shallow inversions can occur without a downturn, especially if driven by non-economic factors.
Confirming evidence: Investors look for other warning signs (weakening PMI, falling earnings, rising unemployment) before panicking.
In 2025, as the yield curve finally starts “un-inverting” and normalizing after a long shriek of inversion, many Wall Street pros debate whether the risk of recession has actually passed or is merely delayed.
How to use the yield curve as an investor: Portfolio strategy tips 🧭
Don’t panic at the first sign of inversion: Markets can act irrationally for months, and inversion is only a warning.
Check your portfolio’s risk profile: Reduce exposure to overvalued, speculative, or cyclical stocks; increase quality and defensiveness.
Focus on cash flow and balance sheets: Companies with low debt and strong, reliable earnings tend to outperform.
Consider shorter-duration bonds: Take advantage of higher short yields with less risk of big price swings.
Watch for confirming macro data: Let PMI, unemployment, and earnings revisions guide your next moves.
Stay diversified: As always, a mix of assets is your best defense against uncertain economic shifts.
Limitations: What a yield curve inversion can’t tell you ❗
No precise timing: History says “recession soon,” but the lag varies and not every instance results in contraction.
Role of global flows: Demand for U.S. Treasuries from foreign buyers or pension funds can distort curve shapes.
Unique cycles: Central bank interventions, massive fiscal policy, or supply chain issues can interfere with historical patterns.
Not a stand-alone tool: Inversions are more reliable when matched with weakening macro indicators, not as isolated, automatic signals.
Where do we stand now? Yield curve signals and the 2025 outlook 🔮
As of late 2025, the U.S. yield curve, after a long period of inversion, has finally started to “normalize”, two-year yields below ten-year yields for the first time in years. Some see this as a positive signal: inflation is under control, and the risk of near-term recession is fading. Others warn that since the curve has been flashing “caution” for so long, markets and the real economy could be vulnerable to surprises. Global investors remain watchful.
Key takeaways and final thoughts 🌟
A yield curve inversion happens when short-term rates exceed long-term rates—historically, a warning sign for recession.
For stocks, it tells investors to expect more volatility, a shift toward defensive sectors, and caution around speculative bets.
For bonds, inversion upends the normal “risk/return” math, making short-term debt unusually attractive and long bonds a source of safety-seeking flows.
No single indicator is perfect. The yield curve should inform your macro view—not trump all your process.
In 2025, the un-inverting curve is a potential relief. But past warnings linger—smart investors use such signals to review, rebalance, and shore up their long-term plans rather than react with panic.
As with all macro signals, context is everything. The yield curve remains one of the sharpest tools in the investor’s toolbox, but only when combined with data, discipline, and long-term thinking.
Poll 📊
🚀 Join 60,000+ investors—become a paying subscriber or download the Winvesta app and fund your account to get insights like this for free!
Disclaimer: This article is for informational purposes only and does not constitute investment advice. Always conduct your own research and consider seeking professional financial advice before making any investment decisions.


Your point about shifting toward defensive sectors during inversions is well taken. Companies like Ubiquiti (UI) fit that profile perfectly with minimal debt exposure and consistent free cash flow generation regardles of the macro environment. The networking infrastructure space provides essential services that remain resilient through economic cycles.