

Understanding technical indicators: RSI and MACD in today’s market


Navigating financial markets in 2025 demands more than gut feeling—technical indicators like RSI and MACD remain among the most trusted tools for traders and investors. These tools are not just lines and numbers on a chart; they represent ways to systematically analyze price movement, gauge market psychology, and build disciplined strategies for entry and exit. With more traders (both retail and institutional) relying on data-driven analysis than ever before, understanding exactly what RSI and MACD tell you—and how to use them in tandem—is essential.
This expanded guide covers everything you need to know about RSI and MACD. We’ll cover the principles, interpretations, strategic uses, and the pratfalls to avoid so you can bring confidence and consistency to your trading toolkit.
🔔 Don’t miss out!
Add winvestacrisps@substack.com to your email list so our updates never land in spam
What is RSI? The market’s momentum gauge 📈
The Relative Strength Index (RSI), developed by J. Welles Wilder Jr., is a popular momentum oscillator. It’s designed to show you—visually and numerically—whether an asset is overbought, oversold, or tracking in a trend.
RSI moves between 0 and 100, typically over a 14-period timeframe.
Above 70: Traditionally considered “overbought,” meaning price may be stretched and due for a reversal or pullback.
Below 30: Considered “oversold,” suggesting the asset might rebound as sellers exhaust themselves.
How is RSI calculated?
RSI is based on the average of recent price gains compared to losses.
Formula: RSI = 100 – [100 / (1 + RS)], where RS is the average gain over n periods divided by the average loss.
You can adjust the lookback period—shorter periods (7 days) respond more quickly, longer ones (21 days) smooth out market noise.
Why does it matter?
RSI is more than just a warning about extreme conditions:
Readings above 50 tend to reflect bullish momentum.
Readings below 50 tilt bearish.
Divergences—when RSI moves opposite price—can signal unsustainable trends.
Practical uses:
Identify quick reversal zones (overbought/oversold).
Confirm trend strength.
Spot continuation or exhaustion signals.
What is MACD? Decoding trends and momentum 🔄
The Moving Average Convergence Divergence (MACD), introduced by Gerald Appel, focuses on trend-following and momentum. MACD tracks the relationship between two exponential moving averages.
The MACD line: Difference between the 12-period EMA and 26-period EMA.
The Signal line: 9-period EMA of the MACD line.
The Histogram: Shows the distance between the MACD and signal line (making crossovers easier to spot).
Why use MACD?
Crossovers: When MACD pops above the signal line, it signals upward momentum; a drop below warns of weakening trends.
Zero line: MACD crossing above or below zero can point to bullish or bearish shifts at the macro level.
Histogram bars: Growing bars (above or below zero) confirm momentum surges.
MACD is especially helpful for:
Validating trend direction.
Flagging the start of potential major moves.
Spotting trend reversals or slowdowns.
Key differences and strengths: RSI vs MACD
Though both RSI and MACD are momentum-based, they approach price analysis from unique angles.
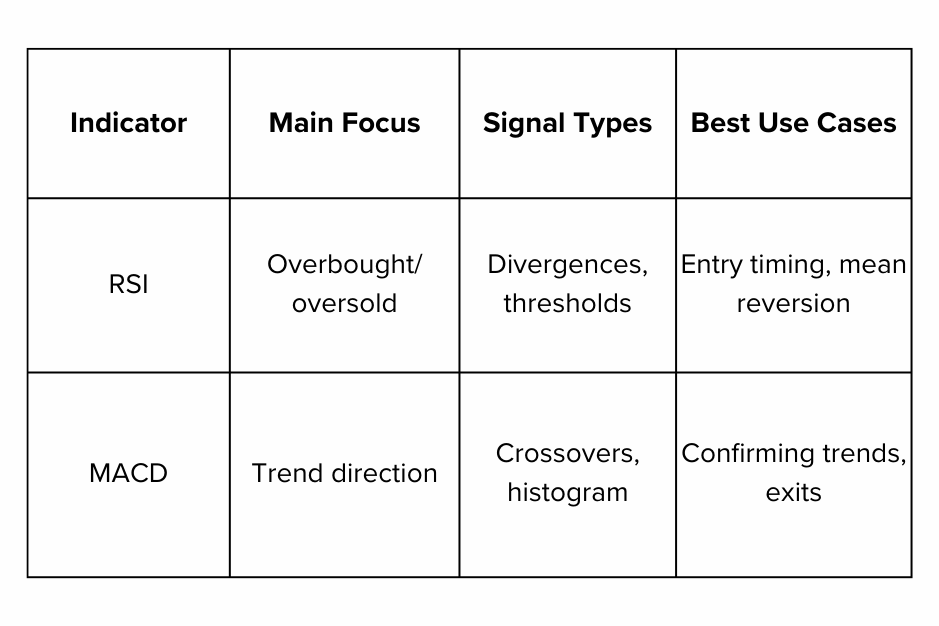
RSI is best for timing entries—when momentum is stretched or waning. MACD is best for staying in a move, confirming broad trends, and reducing “whipsaws” from false signals.
How to combine RSI and MACD: Synergy for smarter trades 🧪
The real power emerges when you use both indicators together. Professionals often apply the following tactics:
MACD confirms the broader trend (bullish or bearish).
RSI filters for high-probability entry zones (overbought/oversold, divergence).
Enter trades when MACD shifts up/down AND RSI crosses key zones (like 50 from below or 70 from above).
Exit or reduce size when either signal starts to reverse.
Example:
Suppose MACD gives a bullish crossover, and RSI is rising from oversold to above 50. That’s a classic “double confirmation”—the odds favor a durable rally.
Practical strategies for today’s trader 🏗️
1. Trend following with MACD
Trade alongside MACD crossovers, not against them. This helps catch major moves and avoid minor market “noise.”
Use the MACD histogram to visualize momentum. Peaks or troughs can signal exhaustion.
2. Spotting reversals with RSI
Watch for RSI crossings below 70 for possible sell signals in strong uptrends.
RSI moving above 30 after a long dip can foreshadow rally.
Monitor for RSI divergence—e.g., price makes higher highs, RSI makes lower highs—classic sign of a weakening trend.
3. Confirming setups with both indicators
Wait for alignment: bullish MACD with rising RSI from below 30; bearish MACD with falling RSI from above 70. This filters out many “false alarms.”
Combine with other price tools—candlestick patterns, volume, and support/resistance levels—to build a robust trade plan.
4. Swing trading and mean reversion
Use MACD to confirm the direction and strength of the swing.
Use RSI to pinpoint where price is stretched too far and likely to “mean revert.”
Limitations and common pitfalls ⚠️

No indicator is perfect. Here are common risks with RSI and MACD:
False signals: Assets can remain overbought or oversold for a long time in strong trends.
Lagging entries: MACD is a lagging indicator, sometimes giving signals after much of the move has happened.
Default settings may not fit all assets: Fast-moving stocks might need shorter RSI/MACD periods, while slow markets need longer ones.
Overreliance: Never use RSI or MACD alone. Markets are complex; look for confluence with other factors.
Overtrading: RSI and MACD can entice “chasing”—wait for true confirmation.
Risk management tips:
Always set stop-losses.
Diversify strategies; no single approach wins in all markets.
Confirm with other indicators and price action.
Using multiple timeframes and integrative analysis 🕰️
Successful traders rarely stick to a single chart. They observe RSI and MACD over multiple timeframes for a full picture.
Daily charts for primary trend.
Hourly/15-min charts for short-term trade timing.
Weekly charts for macro context.
Alignment across timeframes (“bullish on daily and hourly”) offers extra conviction. Divergence between timeframes encourages caution.
Layer in other tools like moving averages, Bollinger Bands, and price structure for a complete strategy.
Adapting RSI and MACD to today’s market realities 🔍
2025 is an age of rapid information flow, AI-driven trading, and fast-moving price action. Using RSI and MACD in this context means:
Shorter timeframes might help catch volatility, but require stricter risk controls.
High market participation by algorithms can cause “self-fulfilling” signals around popular RSI/MACD levels.
Use backtesting and historical analysis to adjust your indicator settings, making sure they reflect current volatility regimes.
Remain alert for major macro events or earnings, which can make short-term readings less reliable.
Best practices for new and seasoned traders 🚦

1. Learn what each indicator means and doesn’t mean.
Understand how RSI represents momentum, why MACD reflects trend, and what triggers are likely to matter most for your asset class.
2. Practice using both tools in simulation or paper accounts.
Test different parameters to find what works for your market and timeframe.
3. Integrate with other analysis methods.
Fundamental factors, recent news, and even social sentiment should inform—not contradict—your technical setup.
4. Watch your position sizing and use stop-losses.
Technical indicators help timing but cannot predict outside shocks; always control risk.
5. Continuously review and adapt.
Financial markets are never static. Adjust strategies as volatility, liquidity, and market participation levels change.
RSI and MACD in different asset classes and trading styles
These indicators are not limited to stocks alone. They work just as well for indices, currencies, commodities, and even cryptocurrencies—with some customization.
Day traders love RSI and MACD for precise entry and exit points on short timescales.
Swing traders use them to filter for high-probability trades amid broad market moves.
Long-term investors check weekly or monthly RSI/MACD to spot macro shifts and avoid major drawdowns.
Case study: A typical RSI/MACD trade in 2025
Let’s say a popular tech stock has rallied over several days. RSI moves above 80, signaling extreme overbought. At the same time, MACD’s histogram begins to “fade,” even as price makes new highs. Savvy traders might wait for MACD to cross below its signal line and RSI to dip below 70 before entering a short or taking profits. The confluence gives more confidence than either indicator alone.
Conversely, after a violent selloff, RSI plunges below 20 and MACD flattens out near zero. As RSI rebounds above 30 and MACD histogram flips positive, a reversal trade may be in order.
Key takeaways and final thoughts 🚀
RSI and MACD remain two of the most accessible, useful momentum and trend indicators in modern trading.
The magic happens when you use them together—confirmation, entry timing, and trend-following in one robust toolkit.
No indicator works perfectly in isolation; combine with price action, volume, and broader market analysis.
Today’s markets move quickly. Mastering RSI and MACD, with disciplined risk management and ongoing learning, will keep you savvy and adaptive through whatever 2025 brings.
Poll 📊
🚀 Join 60,000+ investors—become a paying subscriber or download the Winvesta app and fund your account to get insights like this for free!
Disclaimer: This article is for informational purposes only and does not constitute investment advice. Always conduct your own research and consider seeking professional financial advice before making any investment decisions.