The magic of compound interest: Small gains, big impact
Ever heard whispers about the yield curve and its spooky ability to predict recessions? It's like the financial world's crystal ball, giving investors and economists clues about what's coming down the pike. But what exactly is a bond yield curve, and why does it have such prophetic powers?
Let’s demystify this concept, explore its inner workings, and see why it's a key indicator to watch. No jargon, just straight talk—let’s dive in!
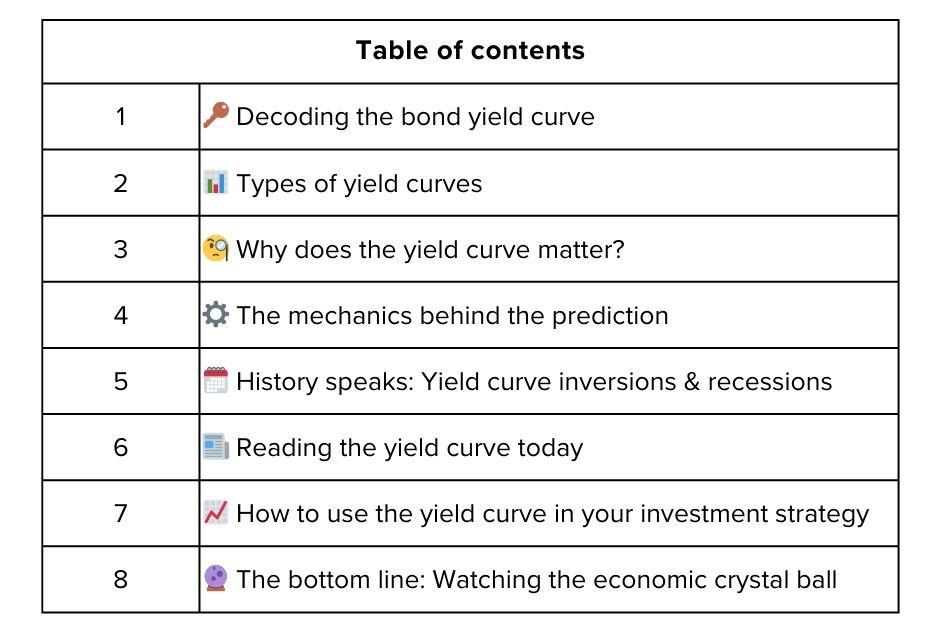
Decoding the bond yield curve 🔑
Think of the yield curve as a snapshot of the bond market. It's a line graph that plots the yields (interest rates) of bonds with different maturity dates. The x-axis represents the time to maturity (e.g., 3 months, 2 years, 10 years), and the y-axis represents the yield.
The anatomy of the yield curve
Short-term bonds: Bonds with maturities of less than a year. These are often influenced by the central bank's (e.g., the Federal Reserve in the U.S., or the Reserve Bank of India) monetary policy.
Intermediate-term bonds: Bonds with maturities of 2 to 10 years. These reflect expectations about future economic growth and inflation.
Long-term bonds: Bonds with maturities of 10 years or more. These are typically used as benchmarks for long-term investments like mortgages.
Types of yield curves 📊
Normal yield curve: This is the most common shape, where long-term bonds have higher yields than short-term bonds. It indicates that investors expect economic growth and inflation to rise in the future.
Why it's normal: Investors demand a higher yield for locking their money up for a longer period.
Inverted yield curve: This occurs when short-term bonds have higher yields than long-term bonds. It's a warning sign that investors expect economic growth to slow or even contract.
Why it's a warning: Investors are pessimistic about the future and prefer the safety of long-term bonds, driving their yields down.
Flat yield curve: This is when there's little difference between short-term and long-term bond yields. It suggests uncertainty about the direction of the economy.
Why it's uncertain: Investors are unsure whether to expect growth or contraction.
Example: Picture a staircase. A normal yield curve is like climbing the stairs gradually, with each step (bond maturity) being slightly higher (higher yield). An inverted yield curve is like going down the stairs, where each step gets lower.
Yield curve mantra
"Watch the shape, heed the warning."
Real-world example: The U.S. Treasury yield curve is one of the most closely watched economic indicators globally, influencing everything from mortgage rates to corporate borrowing costs.
Why does the yield curve matter? 🧐
The yield curve isn't just a pretty chart—it provides valuable insights into market sentiment and future economic conditions.
Predicting recessions
Inversion as a signal: An inverted yield curve is often seen as a reliable predictor of recessions. Historically, it has preceded almost every recession in the U.S.
Why it works: An inversion suggests that investors expect short-term interest rates to fall in the future, which typically happens when the central bank cuts rates to stimulate a slowing economy.
Guiding investment decisions
Portfolio strategy: Understanding the yield curve can help investors adjust their portfolio allocations.
Risk management: An inverted yield curve might prompt investors to reduce their exposure to riskier assets like stocks and increase holdings in safer assets like bonds.
Informing economic policy
Central bank action: Central banks use the yield curve to gauge the effectiveness of their monetary policies.
Fiscal policy: Governments also monitor the yield curve to make informed decisions about fiscal policy, such as infrastructure spending.
The mechanics behind the prediction ⚙️
Why does the yield curve have such a strong track record in predicting recessions? It's a combination of investor psychology, economic fundamentals, and market dynamics.
Investor sentiment and expectations
Fear of the future: An inverted yield curve reflects investors' fears about future economic growth. They believe short-term risks are higher, so they flock to long-term bonds, pushing their yields down.
Flight to safety: This "flight to safety" drives down long-term yields, as investors seek the perceived security of government bonds during uncertain times.
Economic fundamentals
Monetary policy impact: The central bank's actions influence short-term interest rates. When short-term rates rise above long-term rates, it suggests that monetary policy may be too tight, potentially leading to an economic slowdown.
Inflation expectations: Long-term bond yields incorporate expectations about future inflation. If investors believe inflation will remain low, they're willing to accept lower long-term yields.
Market dynamics
Arbitrage opportunities: Large institutional investors exploit any mispricing between short-term and long-term bonds, which can amplify the yield curve's predictive power.
Feedback loop: The yield curve itself can influence economic activity. When businesses and consumers see an inverted yield curve, they may become more cautious, leading to reduced spending and investment.
History speaks: Yield curve inversions & recessions 🗓️
Let's take a quick trip down memory lane to see how the yield curve has performed in the past.
1980s recession: An inverted yield curve preceded the recession in the early 1980s, as the Federal Reserve tightened monetary policy to combat inflation.
Early 2000s dot-com bust: The yield curve inverted before the dot-com bubble burst, signaling an impending economic downturn.
2008 financial crisis: The yield curve inverted in 2006-2007, foreshadowing the housing market collapse and subsequent financial crisis.
2020 COVID-19 recession: The yield curve briefly inverted in 2019, before the pandemic triggered a sharp economic contraction.
Each of these instances underscores the yield curve's reliability as an early warning system for economic trouble.
Reading the yield curve today 📰
So, what's the yield curve telling us now? As of March 12, 2025, the yield on the 10-year U.S. Treasury note is approximately 4.28%, while the 2-year note is yielding around 3.96%. This results in a positive yield spread of about 0.32 percentage points, indicating a normal yield curve.
Interpretation: A normal yield curve suggests that investors expect steady economic growth, with no immediate signs of a recession. However, it's essential to consider this alongside other economic indicators, such as GDP growth, unemployment rates, and inflation, to get a comprehensive view of the economic landscape.
How to use the yield curve in your investment strategy 📈
Here are some practical ways to incorporate the yield curve into your investment strategy:
Diversify your portfolio: If the yield curve is inverted, consider diversifying into defensive assets like bonds, gold, or dividend-paying stocks.
Reduce equity exposure: An inverted yield curve might be a signal to reduce your exposure to equities, especially in cyclical sectors like manufacturing or retail.
Consider longer-term bonds: If long-term bond yields are attractive, locking in those rates can provide stability during economic uncertainty.
Stay flexible: Be prepared to adjust your strategy as market conditions evolve. The yield curve is a dynamic indicator that requires constant monitoring.
The bottom line: Watching the economic crystal ball 🔮
The bond yield curve is a powerful tool for understanding market sentiment and predicting economic trends. While it's not a perfect crystal ball, its historical track record makes it an indicator that every investor should watch.
By understanding the dynamics of the yield curve, you can make more informed decisions, manage risk, and position your portfolio for long-term success. So, keep an eye on that curve—it might just give you a glimpse into the future!
Poll 📊
Disclaimer: All content provided is for informational and educational purposes only and is not meant to represent trade or investment recommendations. Remember, your capital is at risk. Terms & Conditions apply.


