

Enterprise value/EBITDA: A quick guide


Ever wondered how to quickly assess whether a company is a bargain or overpriced? Enter the Enterprise Value to EBITDA (EV/EBITDA) ratio—one of the most powerful valuation metrics used by investors worldwide.
But what makes this ratio so useful, and how can you leverage it for smarter investment decisions? Let’s break it down and see how it fits into your financial toolkit.
What is EV/EBITDA? 🤔
Think of the EV/EBITDA ratio as a business scanner. It helps investors evaluate a company’s valuation by comparing its total value (including debt) to its earnings before interest, taxes, depreciation, and amortization (EBITDA). The formula is:
EV/EBITDA = Enterprise Value (EV) / EBITDA
This ratio gives a clearer picture of a company’s true worth than the traditional Price-to-Earnings (P/E) ratio because it considers both debt and equity—making it a go-to metric for private equity firms, institutional investors, and analysts alike.
Breaking down the formula 📊
To understand EV/EBITDA fully, let’s dissect its components:
Enterprise value (EV): The true market value
Enterprise Value represents the total cost to acquire a company. It includes:
Market capitalization (Total shares outstanding × Stock price)
Debt (Short-term and long-term obligations)
Preferred equity (If applicable)
Minority interest (Stake in subsidiaries not owned fully)
Less: Cash & cash equivalents (Cash reduces acquisition cost)
Essentially, EV reflects what a buyer would actually pay to own the entire business, not just its stock.
EBITDA: Profitability without the noise
EBITDA stands for Earnings Before Interest, Taxes, Depreciation, and Amortization. It is a widely used measure of operational profitability, stripping away non-operational expenses to focus purely on a company’s core earnings.
Why exclude interest? Avoids financing distortions.
Why exclude taxes? Allows cross-country comparisons.
Why exclude depreciation & amortization? These are accounting decisions, not actual cash outflows.
EBITDA helps normalize earnings across industries, making companies more comparable.
Why investors love EV/EBITDA 🚀

The EV/EBITDA ratio is popular because it helps answer critical questions:
1. Is the company fairly valued?
A lower EV/EBITDA (below industry average) suggests a potential bargain, while a higher ratio could indicate overvaluation.
2. How does it compare to peers?
Comparing EV/EBITDA across similar companies helps investors find undervalued opportunities. It ensures you aren’t comparing a capital-light tech company to a debt-heavy utility firm.
3. Does debt affect valuation?
Unlike the P/E ratio, EV/EBITDA accounts for debt levels, making it useful for capital-intensive industries like utilities, telecom, and manufacturing. Companies with high debt might look cheap based on P/E but could be risky when viewed through EV/EBITDA.
4. Is it useful in acquisitions?
Since EV includes debt, this ratio is a key tool in mergers and acquisitions (M&A) to evaluate a company’s purchase price. Private equity firms rely on EV/EBITDA to determine if a company is worth buying, restructuring, and reselling.
5. Cross-border comparisons
Because EBITDA excludes taxes, it makes comparisons across different tax jurisdictions easier. This is crucial for global investors evaluating companies in different countries.
Interpreting EV/EBITDA: What’s a good ratio? 📈
There’s no universal magic number, but general benchmarks exist:
EV/EBITDA < 6: Often considered undervalued (bargain territory).
EV/EBITDA 6 - 12: Fair valuation, varies by industry.
EV/EBITDA > 12: Possibly overvalued, unless justified by high growth potential.
Industry-specific considerations
Not all industries have the same EV/EBITDA norms. Here’s a quick comparison:
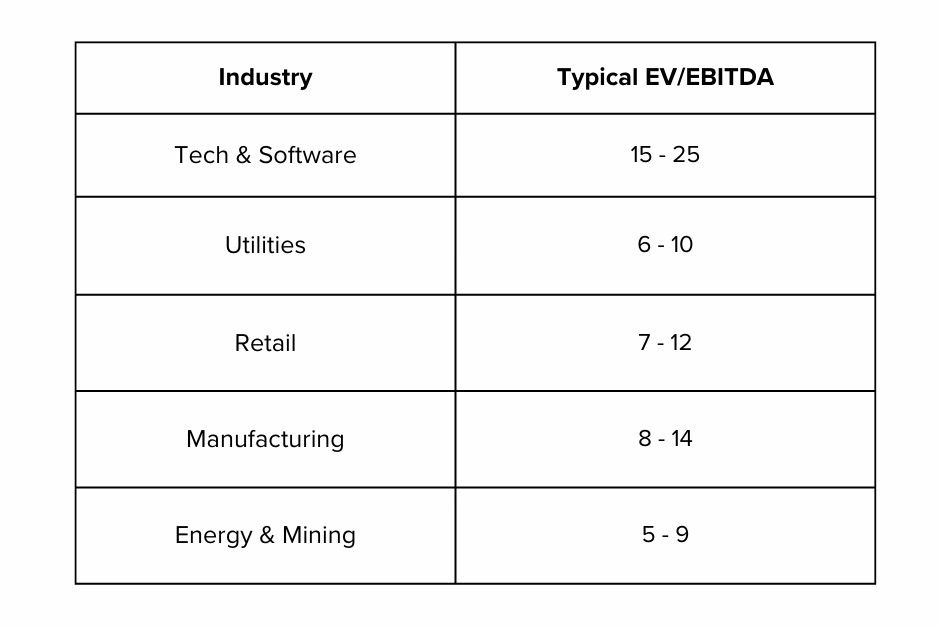
Always compare within the same industry to get meaningful insights.
Common pitfalls when using EV/EBITDA ⚠️
1. EBITDA is not free cash flow
EBITDA does not account for capital expenditures (CapEx), which can significantly impact a company's actual cash flow. This is particularly important in capital-intensive industries like telecom and energy, where high ongoing investments in infrastructure and equipment reduce free cash flow despite a healthy EBITDA.
2. Depreciation & amortization matter
Companies with substantial capital expenditures often report strong EBITDA figures, but ignoring depreciation and amortization can be misleading. These non-cash expenses reflect the wear and tear of assets over time, which eventually requires reinvestment. Always check the cash flow statement to see the real impact on the company's financial health.
3. Industry norms vary widely
An EV/EBITDA multiple of 10x might indicate an undervalued company in one industry but an overvalued one in another. For instance, software companies with high margins and recurring revenue tend to trade at higher multiples, while capital-intensive industries like mining and manufacturing often have lower ones. Always compare valuations within the same sector.
4. Debt-heavy firms can be deceptive
Two companies with identical EV/EBITDA ratios might have drastically different financial risk levels due to their debt structures. A company with excessive debt may face significant interest expenses and financial instability, even if its EBITDA appears strong. To get a clearer picture, analyze the debt-to-equity ratio and interest coverage ratio alongside EV/EBITDA.
5. Temporary earnings distortions
EBITDA can be artificially inflated by one-time gains, accounting adjustments, or cost-cutting measures that are unsustainable in the long run. Factors like asset sales, government subsidies, or temporary expense reductions may give a misleading impression of profitability. Always review financial footnotes and management discussions to identify any non-recurring items affecting EBITDA.
EV/EBITDA in different market conditions 🌍
Understanding how the EV/EBITDA ratio behaves under different market conditions is crucial for investors.
Bull markets
During periods of economic expansion, companies typically have higher EV/EBITDA ratios as investors are willing to pay a premium for future growth.
Investors should be cautious when valuations become stretched beyond historical norms.
Bear markets
In downturns, EV/EBITDA ratios tend to fall as stock prices decline, and earnings may be compressed.
Savvy investors look for companies with low EV/EBITDA ratios that still have strong fundamentals.
Interest rate changes
When interest rates rise, debt becomes more expensive, increasing enterprise value and impacting the ratio.
In high-interest environments, companies with low debt loads are often preferable.
Understanding these shifts can help investors make more informed decisions and avoid valuation traps.
How to use EV/EBITDA in your investment strategy ❓

1. Compare to industry averages
Never analyze EV/EBITDA in isolation, as its relevance depends on industry dynamics. Comparing a company's multiple to its industry peers and historical trends helps determine whether it is overvalued or undervalued. A below-average EV/EBITDA may indicate a bargain—or a struggling business.
2. Check free cash flow (FCF) too
Since EBITDA ignores CapEx, it can sometimes paint an overly optimistic picture of profitability. Always analyze Free Cash Flow (FCF) and FCF Yield to ensure the company is generating real, sustainable cash that can be reinvested or returned to shareholders. A high EBITDA with weak FCF could signal potential financial strain.
3. Adjust for one-time expenses
Watch out for non-recurring gains or losses, such as asset sales, legal settlements, or restructuring costs, which can distort EBITDA. These temporary items may inflate or depress earnings in a given period, making the multiple misleading. Reading footnotes in financial statements can help identify such adjustments.
4. Use with other metrics
No single valuation metric provides a complete picture of a company’s financial health. Combine EV/EBITDA with P/E (Price-to-Earnings), P/S (Price-to-Sales), and debt ratios for a more comprehensive assessment. A company with a low EV/EBITDA but high debt could still be a risky investment.
5. Consider leverage levels
Companies with similar EV/EBITDA ratios may have vastly different debt burdens, affecting their risk profiles. A highly leveraged firm may face higher interest payments, reducing financial flexibility, even if EBITDA appears strong. Checking the debt-to-equity and interest coverage ratios helps avoid hidden financial risks.
Making EV/EBITDA work for you 🎯
The EV/EBITDA ratio is a powerful metric that provides a more complete valuation picture than traditional earnings-based measures. Whether you’re an individual investor looking for undervalued stocks, a fund manager assessing large-scale acquisitions, or a private equity firm seeking investment targets, EV/EBITDA is a crucial tool in your arsenal.
However, no single metric should drive investment decisions. Always consider industry norms, debt levels, cash flows, and market conditions before making a move. Used wisely, EV/EBITDA can help you identify solid investment opportunities and avoid potential pitfalls in an ever-changing financial landscape.
Poll 📊
Disclaimer: All content provided by Winvesta India Technologies Ltd. is for informational and educational purposes only and is not meant to represent trade or investment recommendations. Remember, your capital is at risk. Terms & Conditions apply.