

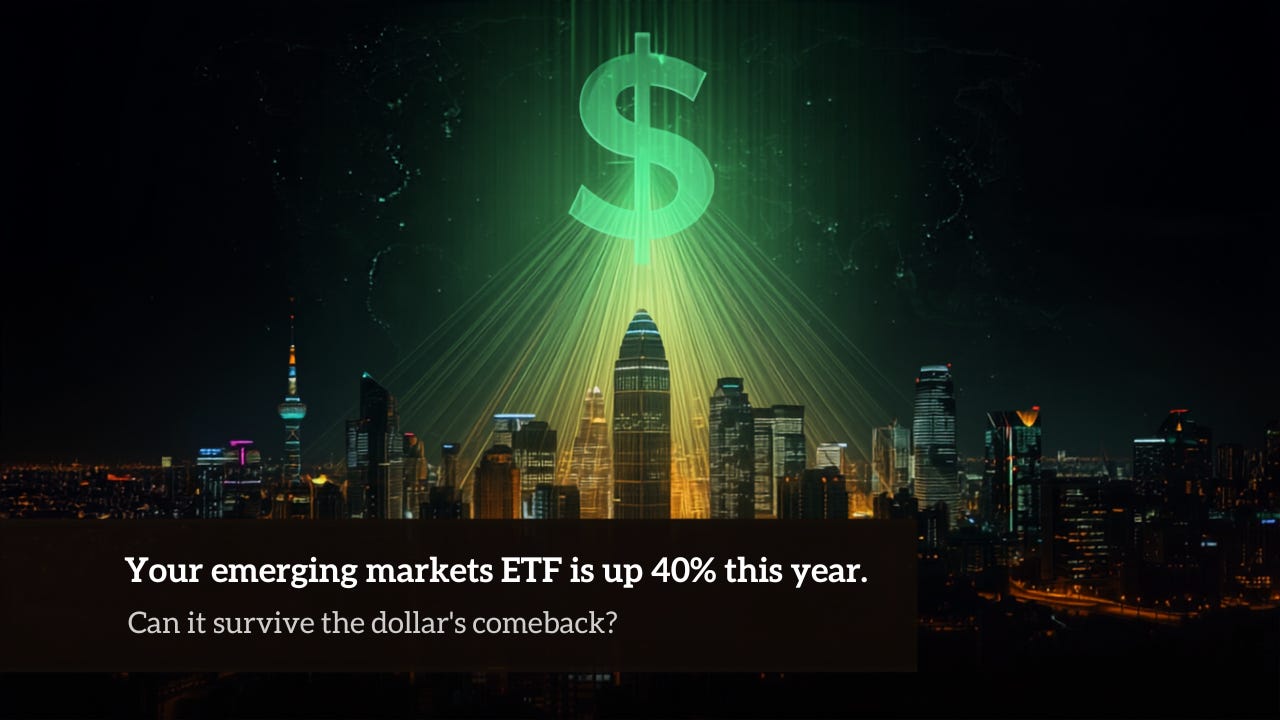
Your emerging markets ETF is up 40% this year. Can it survive the dollar’s comeback?

Five years ago, buying an emerging markets ETF as your “diversify away from the US” trade meant betting on a basket of economies that mostly moved on their own logic. Not anymore. A South Korean memory-chip boom, a Fed chair who just turned hawkish on inflation, and a dollar index sitting at a 13-month high are now pulling EEM and VWO in directions that have very little to do with each other. That’s why we built Winvesta Crisps, to decode what’s actually moving the funds you own, in plain language, before the consensus catches up. 60,000+ investors from all over India are already in. What about you?
🔔 Don’t miss out! Add winvestacrisps@substack.com to your email list so our updates never land in spam.
Most investors who added EEM or VWO this year think they made a smart call to diversify away from a Nasdaq-heavy book. The data says a lot of that money bought more of the same trade, just with a different ticker and a fresh currency risk bolted on. Emerging market ETFs have had one of their best years in over a decade, and a chunk of that run was quietly riding the exact AI hardware cycle that already dominates most Indian investors’ US portfolios. Now the dollar has snapped a months-long slide and printed its highest level in over a year, and that’s the first real test this trade has faced since it started.
🎯 Meet Karthik

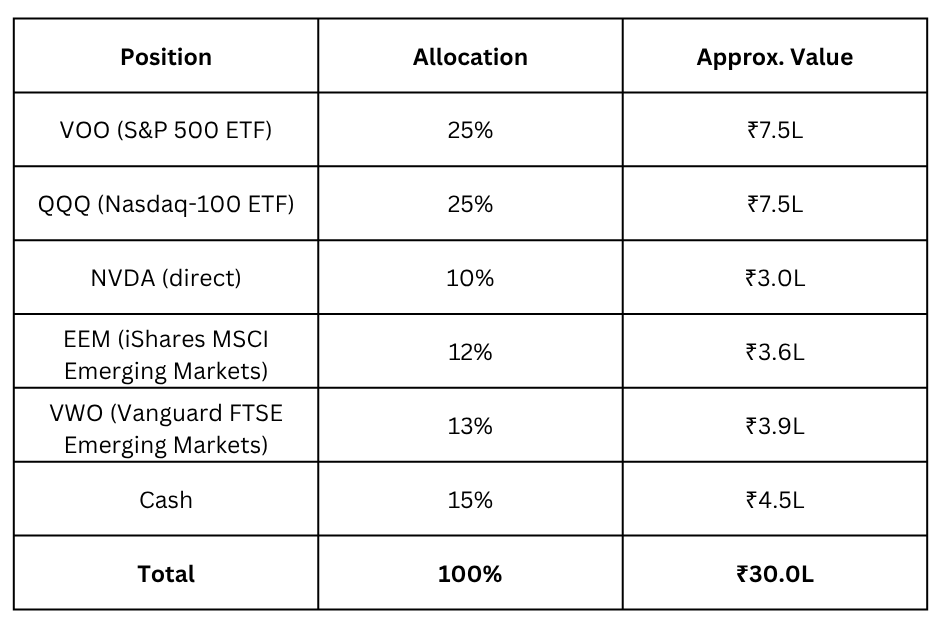
Karthik, 31, product manager in Chennai. Portfolio: ₹30 lakhs across US markets, built over the past three years on Winvesta. His core is VOO and QQQ, plus a direct NVDA position from when it was a much smaller part of his book. Through 2025 and into 2026, every piece he read about index concentration made him uneasy: ten stocks now account for roughly 40% of the S&P 500’s weight, and most of that is the same handful of AI names sitting in his QQQ anyway. So he started building a position in EEM and VWO, telling himself it was the responsible move: real exposure to economies that don’t trade in lockstep with Big Tech.
Here is what he thinks he owns versus what he actually owns.
Three things he believes about this setup, and what’s actually true underneath each one.
“EEM and VWO are my diversification away from US tech.” EEM’s largest country weights right now are China, Taiwan, and South Korea, and the names doing the heavy lifting inside that Taiwan and Korea sleeve are TSMC, Samsung, and SK Hynix, riding the same AI infrastructure and memory-chip wave that already powers his NVDA position and most of his QQQ. He added a second ticket to a ride he was already on.
“EEM and VWO are basically the same fund, just two fund houses.” EEM holds close to 16% in South Korea and charges an expense ratio that is around 10 times VWO’s. VWO excludes South Korea entirely because its index provider classifies the country as developed and instead leans harder into China and India. That single design choice explains most of why his two “identical” EM positions have returned noticeably different numbers this year.
“A stronger dollar mainly threatens my India-linked money.” The rupee has actually held up better than the headline dollar move suggests, helped by the RBI's active intervention. The more immediate risk sits in the EEM and VWO share prices themselves, and in the South Korean won, the Indonesian rupiah, and the Chinese yuan, not specifically in INR.
His real dilemma isn’t “should I own emerging markets.” It’s whether the position he built to reduce his AI concentration risk has quietly become a second bet on the same risk, just priced in a different currency.
📊 What’s actually inside EEM and VWO

Before looking at flows, it’s worth thirty seconds on what these funds actually are, because that’s where most retail investors get the comparison wrong.
EEM (iShares MSCI Emerging Markets ETF) tracks the MSCI Emerging Markets Index, the benchmark most institutional EM mandates are measured against. It holds roughly 25% China, 22 to 23% Taiwan, 16% South Korea, and 12% India, with Taiwan Semiconductor alone making up over 13% of the fund and Samsung, Tencent, SK Hynix, and Alibaba rounding out the top names. The expense ratio is around 0.70-0.72%. EEM is up more than 40% over the trailing year, with some measures putting it above 50%, and roughly mid-teens on a year-to-date basis.
VWO (Vanguard FTSE Emerging Markets ETF) tracks a FTSE index instead, which classifies South Korea as a developed market and excludes it. That single difference pushes more weight into China (around 32%), Taiwan (around 23%), and India (around 20%). The expense ratio is 0.06 to 0.07%, roughly a tenth of EEM’s. VWO is up around 37% over the trailing year and about 8.7% year-to-date by Vanguard’s own figures, lagging EEM mainly because it has no exposure to South Korea’s memory-chip rally at all.
The number that explains the gap between them is South Korea. Samsung Electronics and SK Hynix have been at the centre of the AI memory shortage, and a fund with zero exposure to Korea simply cannot capture that. If he specifically wanted the Korea and memory-chip leg without EEM’s higher fee, a cheaper Korea-inclusive alternative like IEMG exists at a fraction of EEM’s expense ratio; EEM’s main edge over it is a deeper options market, which most buy-and-hold retail investors never use.
Approximate ETF flow picture, illustrative and directional only:
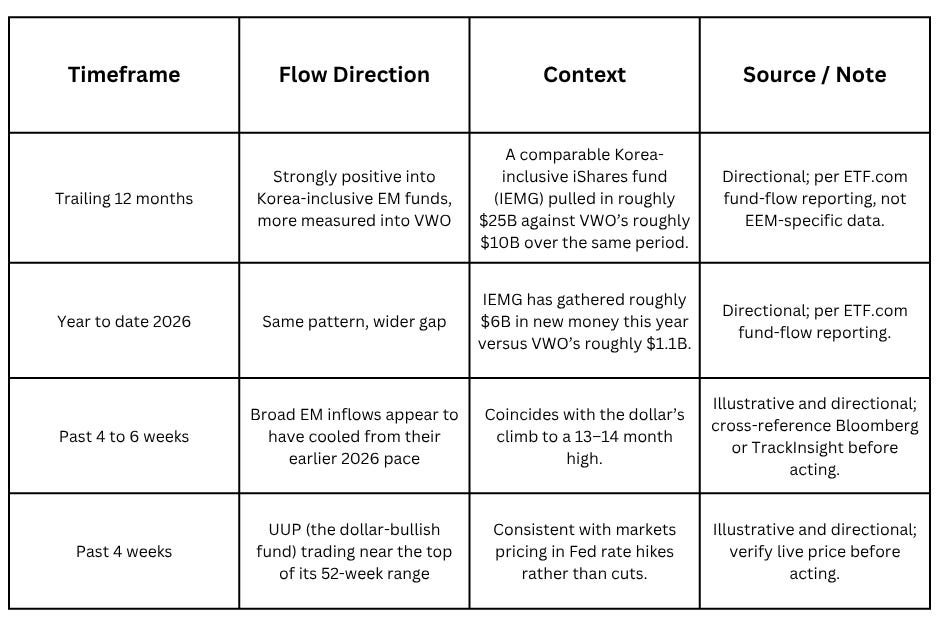
The flow divergence is worth sitting with: money has been rewarding Korea-inclusive EM exposure all year, which is really a way of saying money has been rewarding the memory-chip trade wearing an emerging-markets label. That’s useful to know before assuming “EM” and “diversification” mean the same thing.
Want to add EEM, VWO, or UUP to your portfolio? Trade them directly from India on the Winvesta app. No US bank account needed! 🚀 Join 60,000+ investors, become a paying subscriber or download the Winvesta app and fund your account to get insights like this for free!
💡 Three scenarios for the next six months

Let’s model what happens to his combined ₹7.5L EEM and VWO sleeve, and to his ₹30L portfolio more broadly, under three plausible paths for the next six months.
The following scenarios, probabilities, and return estimates are illustrative stress tests based on assumed returns and subjective probabilities, not forecasts, market consensus, or guarantees of future performance.
Scenario 1 (30% probability): “The hike actually happens”
Setup: The Fed follows through on a September rate hike, the Strait of Hormuz ceasefire breaks down again and oil spikes back above $110, and inflation surprises to the upside. The dollar index pushes through its current 13-month high toward the 103-104 range. Crowded AI-adjacent trades, including Korea’s memory-chip names, get the hardest unwind because that’s exactly where the speculative excess has built up.
Portfolio impact over 6 months:
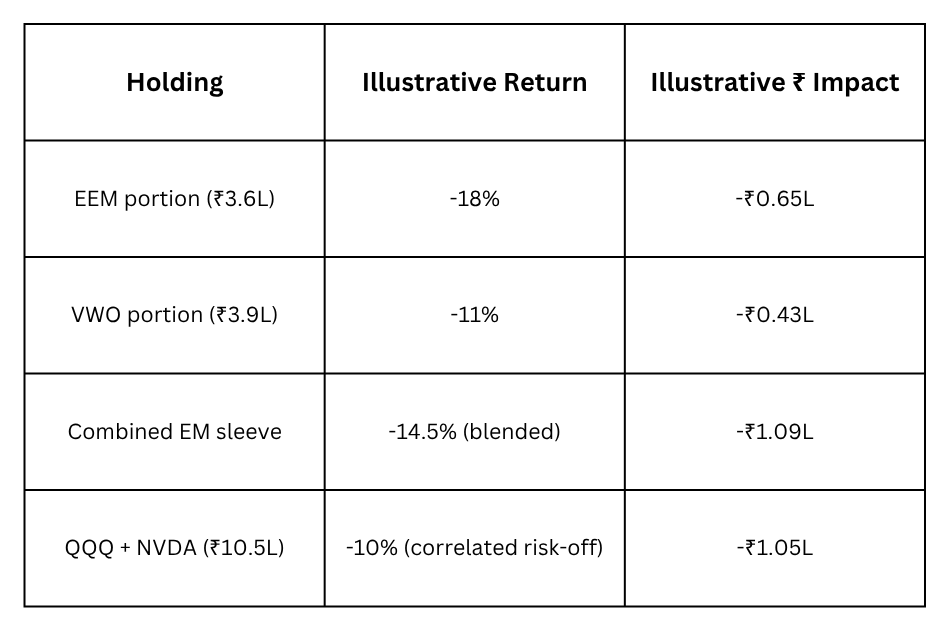
Why only 30%: this requires the Fed to actually hike rather than just keep the option alive, and a fresh Hormuz escalation on top of it. Both are plausible given where things stand this week, but neither is the base case yet.
Emotional gut-check: in this scenario, his “diversification” sleeve and his “concentration risk” sleeve fall together, in the same week, for related reasons. That is the scenario that actually tests whether EEM and VWO were ever hedging anything.
Scenario 2 (50% probability): “Dollar stabilises, the AI leg keeps working without the currency tailwind”
Keep reading with a 7-day free trial
Subscribe to Winvesta Crisps to keep reading this post and get 7 days of free access to the full post archives.