

Why late January is when retail investors get baited into Q1's worst trades

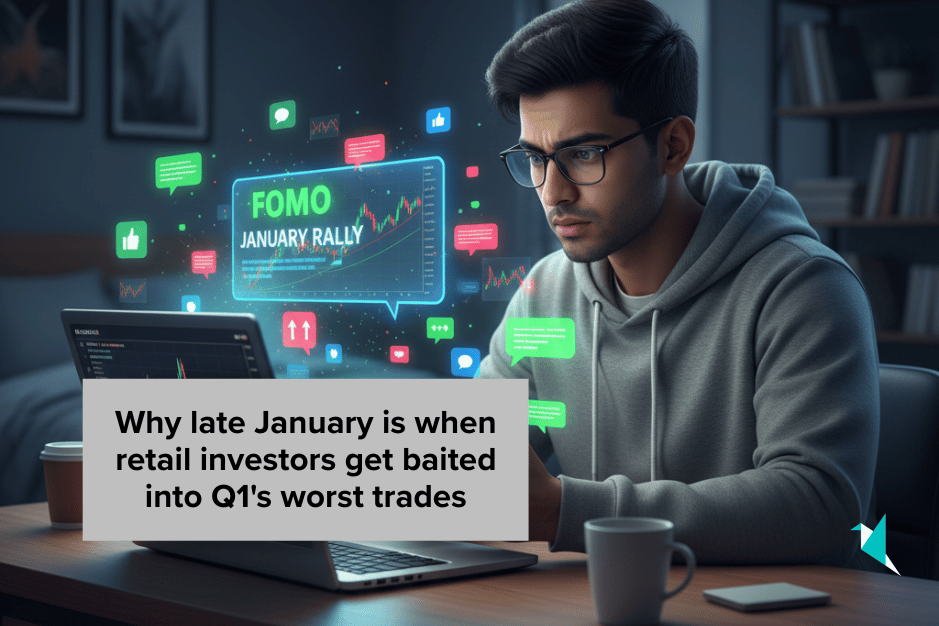
Every January, while headlines scream about the “January Effect” and market momentum, a quieter story often unfolds behind the scenes. Institutional investors—the big hedge funds, pension managers, and asset allocators—tend to lock in their positions for Q1 by mid-February. Meanwhile, retail investors are just starting to feel the FOMO.
This timing gap has become a recognisable behavioural pattern in modern markets: retail investors buying high just as institutions finish positioning, setting themselves up for potentially painful Q1 trades.
If you’ve ever wondered why your January stock picks somehow underperform by March, or why that “can’t-miss” momentum play fizzles in February, this is your answer. The game is rigged—not by malice, but by timing. And understanding this timing gap can save you thousands of dollars in avoidable losses.
🔔 Don’t miss out!
Add winvestacrisps@substack.com to your email list so our updates never land in spam.
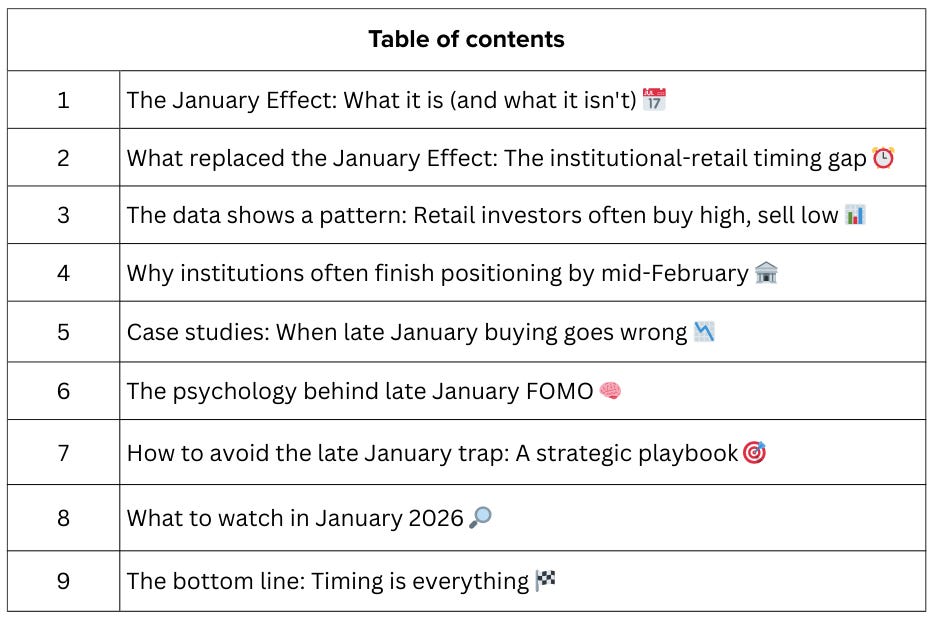
The January Effect: What it is (and what it isn’t) 📅
The “January Effect” refers to a historical pattern where stock prices—particularly small-cap stocks—rise in January more than in other months. First observed in 1942 by investment banker Sidney B. Wachtel, the effect was driven by a simple behavioural pattern: investors sold losing stocks in December for tax-loss harvesting, then repurchased them in January.
The mechanics were straightforward:
December selloff: Individual investors dump underperforming stocks to claim capital losses and reduce their tax bills.
January rebound: After waiting the required 30-day period to avoid wash-sale rules, investors buy back these same stocks—or similar ones—driving prices up.
Small-cap concentration: Since retail investors disproportionately hold small-cap stocks, this effect was most pronounced in smaller companies.
Historical data backed this up. Between 1904 and 1974, small-cap stock returns in January averaged five times higher than in other months. Since 1985, the Nasdaq 100 has risen in 70% of Januarys, with an average return of 2.5%.
But here’s the catch: the classic January Effect has significantly weakened and become less reliable.
Why the effect has eroded:
Tax-advantaged accounts: The explosion of 401(k)s and IRAs means millions of investors no longer face capital gains taxes, removing the incentive for year-end tax-loss harvesting.
Institutional front-running: Once the January Effect became widely known, sophisticated traders began buying in late December, arbitraging away the opportunity and shifting much of the effect into that month.
Market efficiency: With more information and faster trading, anomalies are quickly exploited and reduced.
Global diversification: International markets don’t follow U.S. tax calendars, diluting U.S.-specific seasonal patterns.
The classic January Effect has weakened significantly and become less reliable, with much of the effect shifting into late December in many markets. Any residual effect in January itself is heavily muted and unpredictable.
Someone shared this with you? Get your own insider updates directly—no middleman needed.
What replaced the January Effect: The institutional-retail timing gap ⏰

While the classic January Effect faded, a behavioural pattern emerged—one that’s often more dangerous for retail investors.
Important note: This isn’t a mechanical rule that plays out identically every year, but it’s a pattern that shows up often enough that you should be aware of it and factor it into your investment timing decisions.
The modern dynamic isn’t about tax-driven January rebounds. It’s about when different types of investors tend to deploy capital, and the FOMO cycle that can trap retail investors at suboptimal moments.
Here’s how the new timing game works:
Early January (Week 1-2): Institutions position quietly
Important note: Institutions typically deploy cash that’s been sitting in money market funds immediately after New Year’s. They’re not waiting for confirmation or momentum; they’re establishing positions based on:
Q4 earnings guidance
Macro data resets
Portfolio rebalancing mandates
New allocation strategies for the year
According to Citadel Securities’ 2026 market analysis, January marks the year’s most active allocation window. As markets reopen after holidays, capital tied to retirement contributions (401k, 529), year-end bonuses, and discretionary mandates moves quickly from cash into passive risk assets. Money market cash levels sit at a record $7.6 trillion, creating massive early-year deployment potential.
The key: institutions are buying when prices are relatively stable and before retail attention kicks in.
Mid-January (Week 2-3): Market gains momentum, headlines amplify
As institutional buying lifts markets, the financial media start noticing. Headlines shift from “cautious start to 2026” to “stocks surge on strong January momentum.”
This is when the narrative builds. Analysts point to:
Strong early gains (often 2-4% in major indices)
Sector rotation stories
“Risk-on” sentiment returning
The “January Barometer” (the theory that January performance predicts the full year)
Critical point: Many institutions have built a significant portion of their Q1 positions by this stage. The rallies retail investors are reading about often reflect institutional buying that has already occurred.
Late January (Week 3-4): Retail FOMO peaks
This is where retail investors get trapped.
By late January, markets have posted visible gains. Your portfolio, which was flat in early January, is suddenly up 3-5%. Your friends are talking about their wins. Social media is full of winning trades and “I told you so” posts.
The psychological trap closes:
Recency bias: Recent gains feel predictive of future gains
FOMO (Fear of Missing Out): Everyone seems to be making money except you
Narrative validation: Headlines confirm the rally is “real” and “backed by fundamentals”
January Barometer myth: The false belief that “as goes January, so goes the year”
According to Alight Solutions’ data on 401(k) trading activity, retail trading spikes dramatically in late January, with investors shifting funds from cash and fixed income into equities—buying into the rally rather than ahead of it.
The trap: retail investors often end up buying at elevated prices, after a significant portion of institutional positioning has already occurred.
February (Week 1-2): The reversal begins
By early to mid-February, institutional investors have completed their early-year allocations. New money slows. The market “digests” January gains.
Citadel Securities’ 2026 outlook explicitly states: “Looking ahead, we expect some healthy digestion in February as early-year allocations normalise and volatility has scope to reprice. Any pullback or volatility reset would represent an opportunity to re-engage risk at more attractive levels.”
Translation: Institutions expect a February pullback and plan to buy the dip at better prices.
For retail investors who bought in late January, the gains evaporate, and Q1 underperformance locks in.
The data shows a pattern: Retail investors often buy high, sell low 📊
This isn’t just theory. Multiple academic studies suggest that retail investors tend to systematically misjudge the market, particularly around seasonal periods such as January.
UK study: Roughly 1% annual underperformance from poor timing
A comprehensive long-horizon UK study of retail investors (1992-2009) found that retail fund flows lagged a simple buy-and-hold benchmark by roughly 1 percentage point per year due to poor timing, while institutional investors showed significantly better timing.
The study’s most damning finding: The positive correlation between retail fund flows and returns over the previous six months rose to 40%, but the correlation between retail flows and future returns fell to -17%.
What does this mean in plain English? Retail investors chase past performance—buying after gains have already happened—and those purchases predict lower future returns.
Over an 18-year period, this timing gap compounds into significant underperformance compared to simply buying and holding.
Colombian market study: Bad timing explains underperformance
Analysis of 5.38 million trades by 42,211 individual investors in Colombia (2006-2016) found that retail investors posted negative abnormal returns of -4% to -4.4% per year on a gross basis (before transaction costs).
The key finding: bad timing explains the underperformance. Retail investors didn’t pick bad stocks—they bought and sold at the wrong times, particularly during volatile periods when emotions ran high.
Bank of America: Institutions stay cautious while retail buys aggressively
Bank of America’s May 2025 Global Fund Manager Survey revealed that institutional investors maintained cautious positioning even as retail traders bought aggressively. Institutional investors reduced their underweight positions in U.S. equities from 17% to 13%—showing cautious optimism, not aggressive buying.
Meanwhile, retail trading data from multiple brokerages showed retail investors deploying capital at accelerating rates, buying into rallies rather than ahead of them.
The pattern is consistent: retail investors are contrarian indicators—they buy when they should be cautious and sell when they should be buying.
Know someone who could benefit from smarter timing? Share this article and help them avoid Q1’s classic trap!
Why institutions often finish positioning by mid-February 🏦
Understanding when institutions typically allocate capital explains why retail investors often arrive late to market moves.
The typical institutional calendar:
Early January (Jan 1-10):
Deploy cash that’s been sitting in money market funds
Execute mandatory portfolio rebalancing
Implement new investment strategies for the year
Begin building positions based on Q4 earnings previews
Mid-January (Jan 10-20):
Continue accumulation as the Q4 earnings season begins
Adjust positions based on actual earnings results vs. expectations
Finalise sector allocations for Q1
Late January to Mid-February (Jan 20 - Feb 15):
Many large allocators complete Q1 positioning during this period
New buying often slows as allocations reach targets
Begin evaluating whether January gains are sustainable
Prepare for potential profit-taking if markets extend too far
Post-February 15:
Q4 earnings season typically ends
Institutional positioning is generally locked in
The market often “digests” gains
Volatility sometimes reprices higher
Many institutions wait for better entry points
The critical insight: By the time retail investors feel confident enough to deploy significant capital (late January), many institutions have already positioned substantial portions of their capital and may be taking profits.
Why this matters:
Institutional order flow drives a substantial portion of market moves. When institutions collectively reduce buying, upward momentum often stalls. When they start taking profits, rallies can reverse.
Retail investors, arriving late to the move, sometimes provide the exit liquidity institutions need to lock in their January gains.
Case studies: When late January buying goes wrong 📉
Let’s look at real examples of how this timing gap has played out in recent years. These are illustrative examples—not every January follows this exact pattern —but they show how the dynamics can unfold.
January 2022: Volatility and poor timing
Early January: After an initial weak start, some investors saw brief rallies in specific sectors and attempted to position for a recovery.
Mid-to-Late January: Markets remained volatile. The S&P 500 declined approximately -5.3% in January, with tech stocks hit particularly hard as inflation concerns mounted.
February-March: The market continued struggling in February (down roughly -3.1%) before stabilising and recovering somewhat in March (up approximately 3.6%). However, retail investors who chased specific rallies within the volatile January period often bought at local peaks and faced immediate losses.
Outcome: The choppy conditions in early 2022 demonstrated how difficult it can be to time entries during volatile January periods—institutional investors who positioned defensively or waited for clearer signals fared better than those who chased momentum.
January 2024: Meme stock FOMO
Early January: Small-cap stocks showed strength. Institutional investors quietly accumulated positions in specific small-caps with strong fundamentals.
Late January: Retail investors, influenced by social media and “meme stock” narratives, piled into speculative small-caps that had already risen 20-40%.
February: Profit-taking by early buyers (institutions and savvy traders) reversed gains. Many retail-favourite stocks gave back 15-30% of their January gains within two weeks.
Outcome: The timing gap cost retail investors an average of 8-12% on small-cap positions initiated in late January versus early January.
January 2025: AI and tech rally
Early January: Institutional capital flowed into AI-related stocks and semiconductor manufacturers based on strong Q4 guidance.
Late January: Mainstream financial media amplified the AI theme. Retail investors rushed into AI ETFs and individual AI stocks that had already appreciated 10-20%.
February: Q1 guidance from several AI leaders came in below elevated expectations. Stocks that retail buyers bought in late January corrected 5-15% as institutions took profits.
Outcome: Once again, late-arriving retail capital provided exit liquidity for institutional investors who positioned earlier and more strategically.
The psychology behind late January FOMO 🧠

Why do retail investors consistently fall into this trap, even when the pattern is well-documented?
Cognitive biases that drive late January buying:
1. Recency bias: Recent gains feel more meaningful than long-term data. When markets rise 3-5% in early January, retail investors extrapolate this into future gains, ignoring historical patterns of February reversals.
2. Herd mentality: Humans are social creatures. When friends, family, and social media are discussing their January gains, the pressure to “not miss out” becomes overwhelming—even when rational analysis says markets are extended.
3. Confirmation bias: Retail investors seek information that confirms their desire to buy. In late January, financial media obligingly provide bullish narratives: “Strong start to the year,” “Risk-on sentiment returns,” “Analysts raise targets.”
Negative data—institutional selling, elevated valuations, overbought technical conditions—gets filtered out.
4. Availability heuristic: Recent, vivid examples dominate decision-making. If an investor knows someone who “made 30% in two weeks” on a January trade, that single anecdote will outweigh statistical evidence that most retail investors lose money timing the market.
5. Loss aversion paradox: Ironically, loss aversion (the pain of losses exceeds the pleasure of gains) drives poor timing. Investors become more risk-averse in December (when they should be buying) and more risk-seeking in late January (when they should be cautious) because they’re terrified of “missing out” on gains others have already captured.
6. Narrative over numbers: Stories are more emotionally compelling than statistics. “January Barometer” and “January Effect” are powerful narratives, even though data show they no longer work. Retail investors act on narratives; institutions act on positioning and flow data.
The social media amplification effect
2025-2026 has seen an explosion in financial content on Twitter, Reddit, YouTube, TikTok, and Instagram. This creates an unprecedented FOMO amplification cycle:
Week 1-2: Early institutional gains go unnoticed
Week 2-3: Influencers and content creators post their “January winners”
Week 3-4: Retail investors, bombarded by winning trades in their feeds, experience peak FOMO
Week 4+: By the time retail investors act, the opportunity has passed
Studies show that retail trading activity spikes around periods of intense online attention to specific stocks or themes, often within the same day as viral financial content, creating predictable patterns sophisticated traders exploit.
How to avoid the late January trap: A strategic playbook 🎯
Knowledge is power, but only if you act on it. Here’s your strategy to avoid becoming exit liquidity for institutional investors.
Strategy 1: Front-run the institutional calendar
Action plan:
Deploy capital in early January (January 2-10), not late January
Build positions while markets are still digesting year-end volatility
Accept that you might experience short-term volatility—this is the price of better timing
Use limit orders to avoid buying into early January surges; wait for intraday dips
Why it helps: You’re more likely to be buying alongside institutions, not after them. This often leads to a better entry price than chasing late January momentum, though the exact advantage varies year to year.
Strategy 2: Use the December-January transition
Action plan:
Identify quality stocks that sold off in December due to tax-loss harvesting
Research which stocks institutions are likely to favour (use analyst reports, fund manager interviews, sector rotation themes)
Buy in late December or very early January, before the institutional wave begins
Focus on small-cap and mid-cap stocks where the opportunity is greatest
Why it helps: You’re capturing potential opportunities from stocks that sold off due to tax-driven selling but may rebound as new capital enters the market.
Strategy 3: Fade late January strength
Action plan:
If you missed early January, resist FOMO in late January
Use late January strength to take profits on existing positions, not add new ones
Set calendar reminders: “January 20-25: Review portfolio, take partial profits, resist new purchases”
If you must buy, use extremely disciplined position sizing (start with 25-50% of the intended position)
Why it helps: In many years, February sees at least a modest pullback or consolidation. Waiting for this reset often provides better entry points than late January highs.
Strategy 4: Track institutional positioning data
Action plan:
Monitor 13F filings (institutional holdings reports) for Q4
Follow Bank of America’s monthly Global Fund Manager Survey
Track fund flow data from sources like EPFR, Morningstar, and brokerage reports
Pay attention to options positioning (institutions often use options to build exposure before moving cash)
Why it helps: If you know what institutions are buying (and when), you can attempt to position alongside them rather than after them, though perfect timing is never guaranteed.
Strategy 5: Dollar-cost average through January-February
Action plan:
Instead of lump-sum investing in late January, spread purchases across January and February
Allocate 30% in early January, 40% in late January, 30% in early February
Rebalance based on market behaviour—if January rallies hard, shift more capital to February; if January is weak, allocate more to January
Why it helps: DCA removes the pressure to “time the bottom” perfectly and helps ensure you don’t concentrate all your purchases at potentially elevated late-January prices.
Strategy 6: Inverse retail sentiment
Action plan:
Use retail sentiment indicators (available from brokerages, social media analytics, and AAII Sentiment Survey)
When retail bullish sentiment hits extreme levels (>60%) in late January, reduce exposure instead of adding
When retail bearish sentiment peaks in December or early January, increase exposure
Why it helps: Retail sentiment has historically shown some value as a contrarian indicator. Extreme bullishness often marks local tops; extreme bearishness often marks bottoms, though this relationship isn’t perfect.
Strategy 7: Accept that sometimes “doing nothing” is the right trade
Action plan:
If you miss the early January window and markets have already rallied 3-5%, sit tight
Wait for the February pullback or consolidation
Use the time to research, build watchlists, and prepare for better opportunities
Why it helps: Patience can pay off. The potential cost of missing a 3% gain in late January is often small compared to the risk of a larger loss if you buy at a peak and hold through a February reversal.
What to watch in January 2026 🔎
If you’re reading this in January 2026 (or want to prepare for January 2027), here are the specific timing indicators to track:
Week 1 (Jan 1-7):
Watch: Institutional fund flow data from major brokerages
Signal: If institutional flows accelerate in the first week, expect a strong January rally—position early
Action: Begin building positions in sectors showing institutional interest
Week 2 (Jan 8-14):
Watch: Market momentum and breadth (advancing vs. declining stocks)
Signal: If breadth is strong (many stocks participating), rally has room to run; if breadth is weak (few stocks leading), rally is fragile
Action: Add to positions if you’re underexposed; take partial profits if overexposed
Week 3 (Jan 15-21):
Watch: Retail sentiment indicators, social media trending topics, brokerage retail trading data
Signal: Peak retail FOMO = time to get cautious
Action: Stop adding new positions; consider taking profits on extended names
Week 4 (Jan 22-31):
Watch: Options expiration (often late January), institutional profit-taking signals
Signal: If major indices stall or reverse on high volume, institutions are exiting
Action: Reduce exposure, raise cash for better opportunities in February
Early February (Feb 1-15):
Watch: How markets handle Q4 earnings completion and the post-January “digestion” period
Signal: Any pullback of 2-4% is normal and healthy—provides better entry points
Action: Use weakness to add to high-conviction positions at better prices
The bottom line: Timing is everything 🏁

The January Effect of the 1940s-1980s has significantly weakened. What often appears in its place is more subtle: a timing gap between institutional positioning (typically early January) and retail FOMO (often late January).
This gap tends to create a recognisable pattern:
Institutions buy early and position: Often January 1-15
Media amplifies the gains: Typically, January 10-20
Retail investors pile in: Frequently January 20-31
Institutions take profits: Often February 1-15
Retail investors watch gains evaporate: Sometimes February-March
The data suggests a persistent pattern: retail investors who buy in late January often underperform those who buy in early January, and timing costs can add up to roughly 1% annually when compounded across many market cycles.
Three actionable takeaways:
Consider deploying capital in early January (Jan 1-10), not late January. Attempt to buy alongside institutions, not after them.
If you miss early January, resist FOMO. Often it’s better to wait for a February pullback to establish new positions at more favourable prices.
Use institutional positioning data and retail sentiment as timing guides. When institutions are buying, and retail is fearful (early January), consider being more aggressive. When retail is euphoric, and institutions have already positioned (late January), consider being more cautious.
The market often rewards those who buy before the crowd, not after it. Late January is when retail investors frequently arrive too late, potentially providing exit liquidity for institutions that positioned two to three weeks earlier.
Understanding this timing dynamic won’t make you perfect, but it can help shift the odds more in your favour.
Disclaimer: All content provided by Winvesta India Technologies Ltd. is for informational and educational purposes only and is not meant to represent trade or investment recommendations. Investing in securities involves risk, including potential loss of principal. Past performance is not indicative of future results. Remember, your capital is at risk. Terms & Conditions apply.
Join 60,000+ investors and download the Winvesta app to get more insights like this for free!