

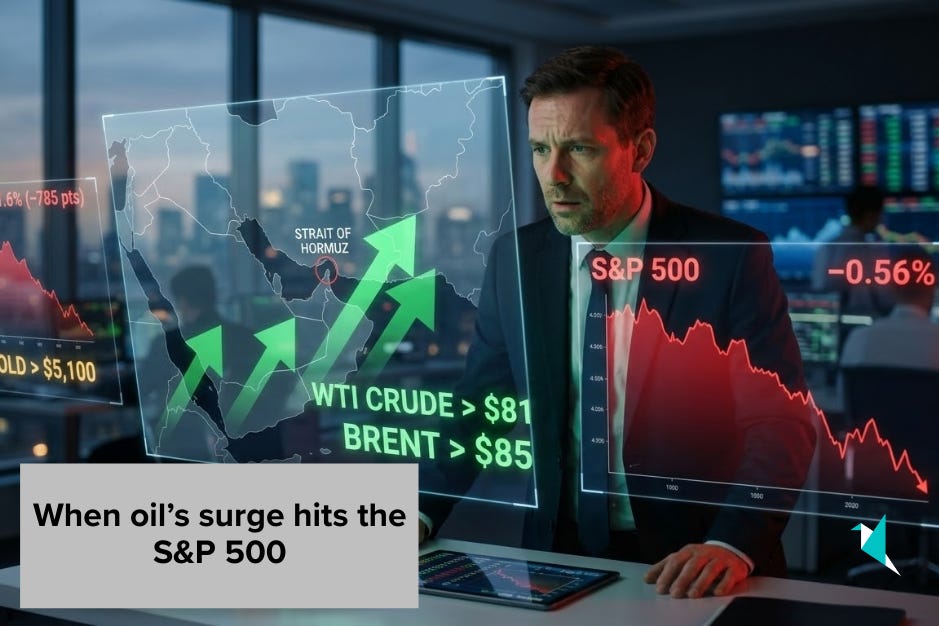
When oil’s surge hits the S&P 500
Most investors saw the Dow’s 785-point headline and panicked. Meanwhile, energy stocks were surging, gold was holding near record highs above $5,100, and the real question wasn’t “how bad is this?”—it was “who’s positioned for what comes next?” The data was everywhere. The playbook was nowhere.
That’s why we built Winvesta Crisps—to decode what’s actually driving the market each week, in plain language, before the consensus catches up.
60,000+ investors from all over India are already in. What about you?
🔔 Don’t miss out!
Add winvestacrisps@substack.com to your email list so our updates never land in spam.
The S&P 500 didn’t crash like the Dow this week—but it told you just as much about how fragile this market really is. On Thursday alone, the index slipped about 0.6% as oil ripped back above $80 and Middle East tensions escalated, while the Dow plunged 785 points (-1.6%) in its heaviest single-day loss in weeks. Beneath those modest-sounding percentage moves, you had a classic stagflation scare: higher energy costs, stickier inflation fears, and investors suddenly questioning how many rate cuts 2026 really deserves.
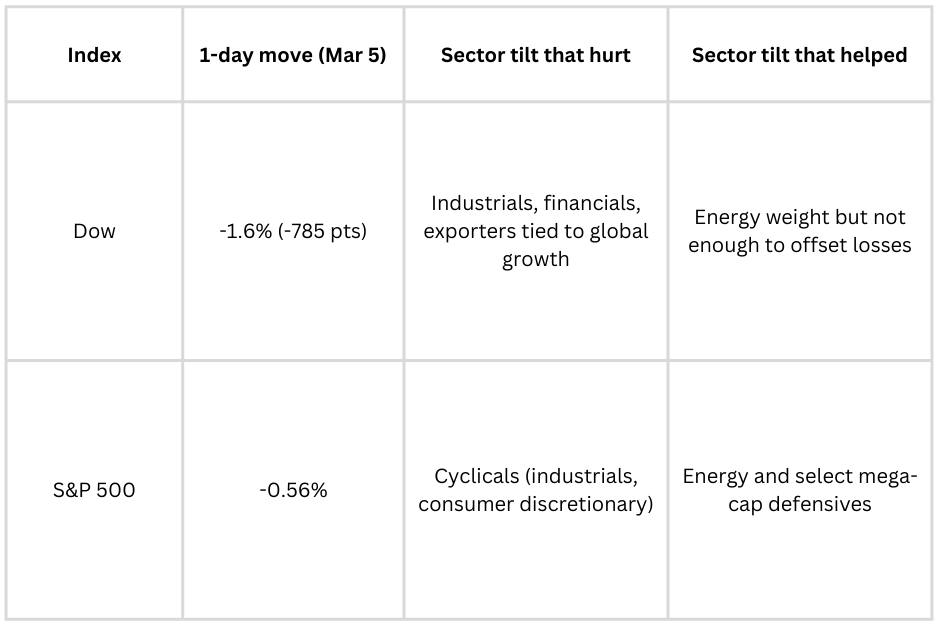
🔥 Dow vs S&P 500: Same shock, different story
On the surface, Thursday looked like a “Dow story.” Underneath, it was really about how oil and macro fear are repricing the whole U.S. market.
What changed on the day: U.S. crude jumped 8.5% to just over $81, its biggest one-day rise since 2020 and the highest level since mid-2024, while Brent climbed above $85 as Iran’s actions severely disrupted traffic through the Strait of Hormuz. The 10-year Treasury yield pushed back above roughly 4.1%, a modest move in basis points but a clear break from the “easy-cuts-are-coming” narrative.
🍏 Current landscape
The week’s price action revealed a market caught between two competing forces: the inertia of a bull market that has run for over a year, and the sudden reappearance of a risk that AI hype and the strength of AI services had pushed to the background—energy.
The Iran conflict as market catalyst: The U.S.-Israel military operation against Iran, now in its second week, escalated sharply when Iran moved to blockade the Strait of Hormuz, severely disrupting tanker traffic. Roughly 20% of global oil flows through that chokepoint, and the disruption sent crude prices surging. WTI hit just over $81, Brent pushed above $85—levels not sustained since mid-2024.
Inflation expectations repriced: Higher energy costs feed directly into headline inflation, complicating the Fed’s path. Markets have nudged rate-cut expectations further into 2026, with a first move now seen as more likely mid-year or later. The 10-year yield’s push back above 4.1% was modest in absolute terms but psychologically significant after weeks of trending lower.
Dow composition amplified the pain: The Dow’s price-weighted structure—where high-dollar stocks like UnitedHealth and Goldman Sachs disproportionately drive index moves—meant its 1.6% decline looked far more dramatic than the S&P 500’s 0.56% drop. But both indices told the same story: cyclicals under pressure, energy outperforming, and defensives catching bids.
🌀 Turning the tables

How are portfolios quietly rotating as oil reshapes the macro picture?
1. Defensive rotation inside the S&P 500
Consumer-staples ETFs like XLP saw clear inflows as investors swapped out of economically sensitive names into steady cash-flow businesses such as Procter & Gamble and Coca-Cola. Utilities lagged the broader market, acting as a classic shock absorber when growth and inflation worries collide.
2. Energy sector paradox
S&P 500 energy names, including integrated majors, were among the few bright spots as higher crude fed straight into upstream earnings expectations. At the same time, refiners and fuel-sensitive businesses face a squeeze if demand slows but input costs stay elevated.
3. Volatility and hedging
The VIX had already jumped into the mid-20s this week, its highest level since late 2025, as headlines about Iran pushed traders to pay up for protection. S&P 500 put volumes picked up versus calls, reflecting renewed demand for downside hedges after months of complacency.
✨ What is working?
Oil’s spike hasn’t hit every corner of the market the same way.
Energy equity leverage: XLE and other energy ETFs posted strong gains as crude broke above $80, making S&P energy one of the only sectors comfortably green on the week.
Gold’s bid: Gold recently raced past $5,100 per ounce to an all-time high on safe-haven demand and inflation hedging, with prices still hovering near that zone. The metal has surged around 60% over the past year.
Dollar and short duration: A firmer dollar and a grind higher in Treasury yields favoured short-duration bond ETFs over long-duration as the curve steepened.
Quality dividends: Long-standing dividend growers in the S&P 500 fell less than the index on the worst days, again showing why reliable cash flows still matter in macro shocks.
Want to position around these trends? You can trade S&P 500 names and Dow components directly from India on the Winvesta app—no U.S. bank account needed.
🚀 Join 60,000+ investors—become a paying subscriber or download the Winvesta app and fund your account to get insights like this for free!
🚩 Key challenges ahead
Keep reading with a 7-day free trial
Subscribe to Winvesta Crisps to keep reading this post and get 7 days of free access to the full post archives.