



Japan has raised interest rates twice this year, taking its policy rate to 1.25 per cent, the fastest pace of tightening the Bank of Japan has run since 1990. That sounds like a domestic story about Japanese savers finally earning something on their deposits. It is not. Cheap yen has spent two decades funding trades everywhere from Wall Street tech stocks to Indian equities, and the last time this specific trade unwound, it erased more than a tenth of the Nikkei in a single session and reached straight into Indian portfolios. That is why we built Winvesta Crisps, to break down what is actually moving markets, in plain language, before the consensus catches up. 60,000+ investors from all over India are already in. What about you?
🔔 Get the Wednesday macro breakdown in your inbox every week, before the headlines catch up. Subscribe now!
Most Indian investors who hold US stocks have never placed a single yen trade in their life, and their returns are still exposed to one. The mechanism runs through a currency most of them have never converted, a central bank most of them do not follow, and a trade that is sized, depending on whose estimate you trust, anywhere from a couple of hundred billion dollars to well over two trillion. Nobody actually knows the exact number, which is itself the point. In August 2024, that uncertainty turned into the worst single trading day for Japanese stocks since 1987. Japan is hiking again, faster than it has in thirty five years, and the question worth asking is not whether this happens again, but what it drags down with it this time.
📜 What the yen carry trade actually is
For most of the last two decades, Japan kept interest rates at or near zero while the rest of the world's central banks did not. That gap created one of the most durable trades in global finance: borrow yen for almost nothing, convert it into dollars or another higher-yielding currency, and buy assets that pay more than the yen loan costs. US tech stocks, European bonds, Australian dollars, Indian equities, all of it has at some point been funded, in part, by yen borrowed at close to zero per cent.
The trade works beautifully until two things happen at once: Japanese rates rise, making the yen loan more expensive, and the yen itself strengthens, making the loan more expensive to repay in whatever currency the profits came in. Both happened in early August 2024, when the Bank of Japan raised rates and signalled more hikes to come. The yen surged, funding costs jumped, and leveraged positions across the world got margin calls on the same days. The Nikkei 225 fell 12.4 per cent on 5 August 2024, its worst single day since Black Monday in 1987. The selling did not stay in Tokyo. US and European equities fell hard in sympathy within hours, because the funds unwinding yen positions were selling whatever they held that was liquid, not just Japanese assets.
Estimating the size of the trade today is genuinely difficult, and any number you read should be treated as a range, not a fact. Cross-border yen borrowing, the broadest measure of how much global leverage is funded in yen, has been estimated in the trillions of dollars by some bank research desks. Narrower measures of speculative positioning, which try to isolate the specific bet that the yen stays weak, have put the figure closer to a few hundred billion dollars. The gap between those estimates is the real story. Markets found out how large the trade actually was in August 2024 only after it broke.
⚙️ How an unwind actually spreads
The mechanism is not complicated once you see it, which is part of why it catches people out. A leveraged position funded in yen has two exposures stacked on top of each other: the return on whatever was bought, and the yen's exchange rate against the currency that return is measured in. When the Bank of Japan hikes, it attacks both exposures simultaneously. The cost of servicing the yen loan rises, and the yen tends to strengthen as higher Japanese rates attract their own capital inflows, which means the loan is now more expensive to repay in yen terms too.
For a leveraged fund, that combination forces deleveraging, often through a margin call rather than a considered decision. The fund does not sell only its Japanese holdings. It sells whatever is most liquid and easiest to convert back into yen quickly, which in practice means the most widely held, most heavily traded assets in the world: large cap US technology stocks, liquid emerging market equities, currencies seen as risk-on bets against the dollar. That is the channel through which a Bank of Japan decision reaches a portfolio that has never touched a yen-denominated instrument.
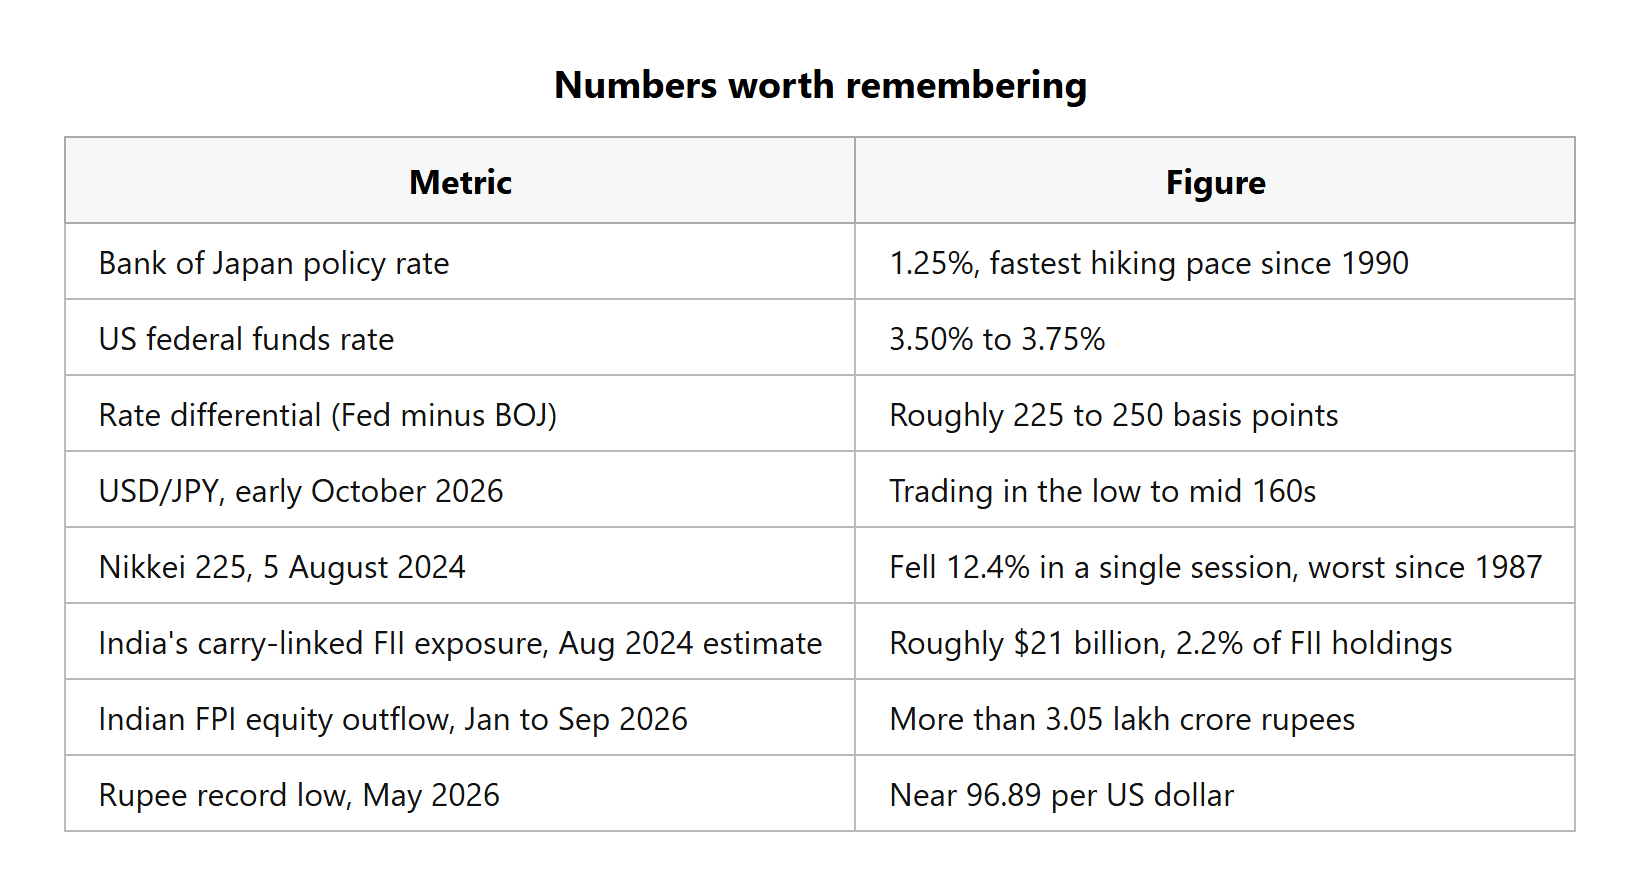
The current cycle looks different from 2024 in one respect worth naming plainly. The Bank of Japan has been signalling its hiking intentions well ahead of each move this time, under Governor Kazuo Ueda, and markets have had weeks rather than hours to reduce yen-funded exposure in response. The federal funds rate sits at 3.50 to 3.75 per cent against Japan's 1.25 per cent, a gap of roughly 225 to 250 basis points, which still leaves the carry trade profitable on paper even after this year's hikes. US Treasury Secretary Scott Bessent has also been pushing Tokyo publicly toward faster tightening, which has added political pressure on top of the economic case. So far, that combination of advance warning and a still wide rate gap has meant a gradual unwind rather than a repeat shock. The gap narrowing further, or a hike landing with less warning than the market expects, is what would change that.
The mechanics of a trade most Indian investors have never heard of are already reaching into every US stock held from India, through exactly this kind of global deleveraging. Trade US markets from India on the Winvesta app, no US bank account needed.
🚀 Join 60,000+ investors, become a paying subscriber or download the Winvesta app and fund your account to get insights like this for free!
⚖️ Who wins and who loses if the unwind accelerates
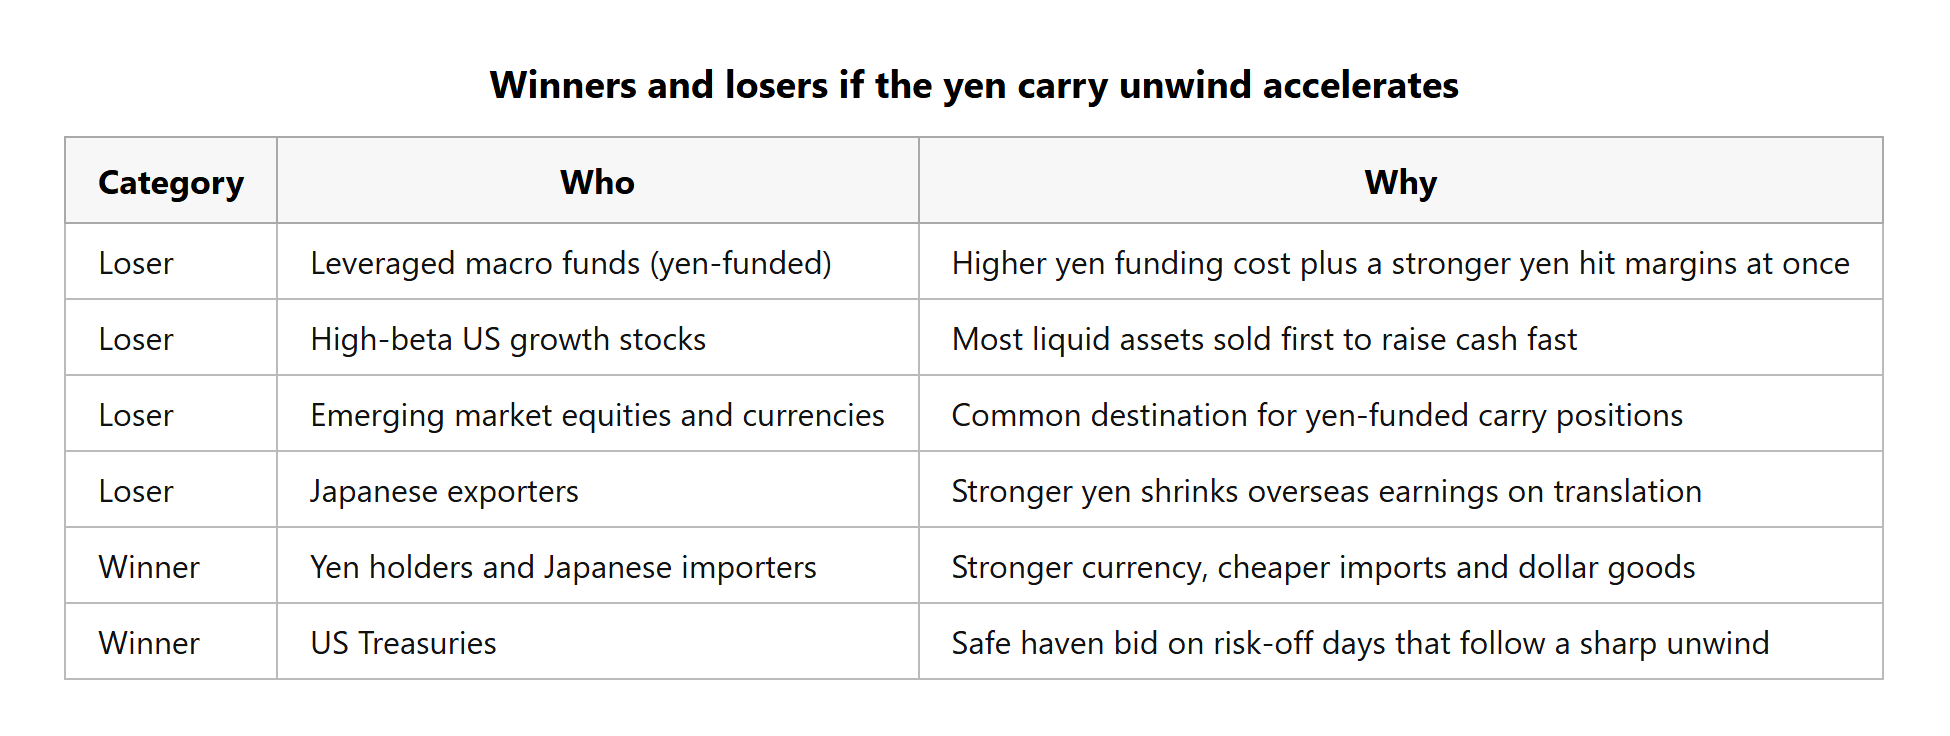
Leveraged macro funds running yen-funded positions are the clearest losers in a sharp unwind, for the reasons above, and so are the assets they are forced to sell to raise yen quickly. High beta US growth stocks tend to fall harder than the broad market in these episodes, not because anything changed in their underlying business, but because they are among the most liquid things a deleveraging fund can sell in minutes. Emerging market currencies and equities carry the same exposure, since they are common destinations for yen-funded carry positions and get sold alongside everything else when the trade reverses.
Japanese exporters sit in an uncomfortable middle position. A stronger yen makes their overseas earnings worth less when translated back home, which is why Japanese equities, particularly the export-heavy names on the Nikkei, were among the hardest hit in August 2024 even though the shock originated in their own central bank's decision.
The clearer winners are harder to name with the same confidence, which is itself informative. Yen holders and Japanese importers benefit from a stronger currency, as do Japanese households buying anything priced in dollars. US Treasuries tend to catch a safe haven bid during the risk-off days that follow a sharp unwind, even though the hike that triggered the unwind came from Japan, not the Federal Reserve. Beyond that, a carry trade unwind is mostly a story about who gets hurt and by how much, not who profits from it.
🇮🇳 What this means for an Indian investor holding US equities
India is not a bystander to this trade. Market estimates at the time of the August 2024 unwind put India's yen carry trade linked exposure at around 21 billion dollars, close to 2.2 per cent of total foreign institutional investor holdings, a meaningful enough slice that the unwind showed up directly in FII selling data that month.
The 2026 numbers suggest the exposure, or at least the sensitivity, has not gone away. Foreign portfolio investors pulled more than 3.05 lakh crore rupees out of Indian equities across the first nine months of 2026, with selling continuing into October, including a further outflow of roughly 9,232 crore rupees in the opening days of the month alone, according to NSDL linked flow data. The rupee hit a record low near 96.89 to the dollar in May 2026. None of that selling is solely a yen story. US yields, crude oil prices and India's own earnings season have all played a part. But a yen carry unwind adds to exactly the same selling pressure, through the same mechanism described above: funds raising cash fast tend to sell whatever is liquid, and Indian large caps qualify.
For an investor holding US equities through Winvesta, the read-through is about correlation rather than a reason to change allocation. A disorderly yen unwind tends to arrive alongside a broad risk-off day across global equities, US stocks included, and alongside rupee weakness that changes what a given dollar return is worth once converted home. Those two effects can compound in the same direction on the worst days, and recognising the shared cause is more useful than treating a US portfolio dip and a weak rupee as two unrelated events.
👀 What to watch from here
The Bank of Japan's forward signalling is the single most useful thing to track, since Governor Ueda's public comments have been the clearest advance warning markets have had this cycle, a sharp contrast with the limited notice ahead of the August 2024 hike. A hike that lands with less warning than the market has grown used to is the scenario most likely to reproduce 2024 rather than extend the gradual pattern seen so far this year.
USD/JPY itself is worth watching as a level, not just a headline. The pair has been trading in the low to mid 160s, levels that have previously drawn explicit intervention threats from Japan's Ministry of Finance, with 155 to 160 flagged by several trading desks as the zone where intervention risk rises materially. A sudden, sharp yen move in either direction, rather than a gradual drift, is historically the trigger for forced unwinds rather than the level itself.
The Federal Reserve's own rate path matters just as much as Japan's, since the entire trade runs on the gap between the two. A faster pace of Fed cuts than currently priced would narrow the rate differential from the other side and could squeeze carry positions even without any further move from Tokyo. Cross-border yen funding data, published periodically by the Bank for International Settlements, is the slowest moving but most reliable signal of how much leverage is actually built up in this trade at any given time, even though it arrives with a lag.
If this changed how you read a quiet day in Japanese interest rates, pass it on.
💡 The bottom line
The yen carry trade is not a niche derivatives story. It is one of the largest, least visible sources of leverage in global markets, funded by a central bank most Indian investors never think about, and it has already proven, in a single trading day in August 2024, that it can take down US and Indian equities alongside Japanese ones. The Bank of Japan is hiking faster now than at any point since 1990, the rate gap with the Federal Reserve is narrowing, and the trade is unwinding more gradually this time only because Tokyo has chosen to signal its moves well in advance. That pattern can break with one less predictable hike. An Indian investor holding US equities does not need to trade the yen to be exposed to it. The exposure already runs through the portfolio, via exactly the kind of global deleveraging that turned a Japanese rate decision into the Nikkei's worst day since 1987.
📊 Numbers worth remembering
This article is for educational purposes only and does not constitute investment advice. Winvesta India Technologies Ltd. does not guarantee the accuracy of third-party data cited above. Past performance is not indicative of future returns. Please consult a registered financial adviser before making investment decisions.