


One Friday evening at 6 pm IST, a single survey result from a US government agency repriced every US stock in your portfolio. On 7 August it came in at minus 23,000 jobs against a forecast of plus 83,000, and the unemployment rate went down at the same time. Neither figure is a misprint, and the reason they can both be true tells you something uncomfortable about the data your holdings react to every month. That's why we built Winvesta Crisps: to break down what's actually moving markets, in plain language, before the consensus catches up. 60,000+ investors from all over India are already in. What about you?
🔔 Don't miss out!
Add winvestacrisps@substack.com to your email list so our updates never land in spam.
The US economy shed 23,000 jobs in July, per the Bureau of Labor Statistics, when economists polled by Dow Jones had expected a gain of 83,000. The unemployment rate fell to 4.1 per cent, when the same economists expected it to stay at 4.2 per cent. The S&P 500 closed at a record 7,757 that day. Most people don't realise how deep this runs: the margin of error on that monthly payroll number is about plus or minus 122,000 jobs at 90 per cent confidence, per the BLS technical note accompanying the release. July's minus 23,000 is statistically indistinguishable from plus 99,000. The number that moved markets cannot tell you, with any confidence, whether the US added jobs last month or lost them.
📉 What actually happened on 7 August
Three things landed in the same release, and each one pulled in a different direction.
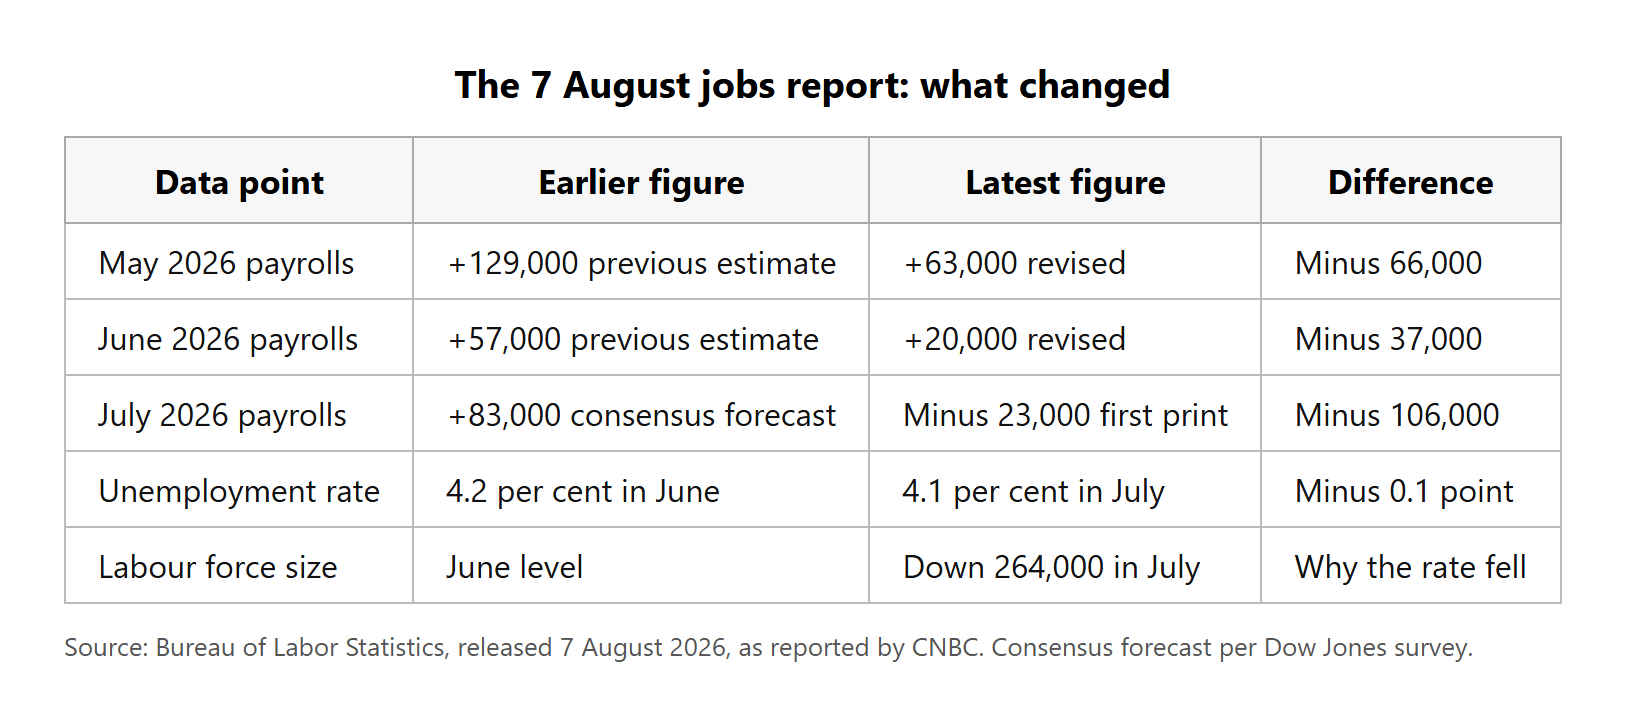
The payroll count fell. US employers cut 23,000 jobs in July, the first monthly decline in this cycle's recent run, against a consensus of plus 83,000.
The previous two months got rewritten. May's gain was revised down by 66,000 to 63,000, and June's was cut by 37,000 to 20,000. Together, 103,000 jobs that the market had already traded on turned out not to exist.
The unemployment rate improved anyway, to 4.1 per cent. That was not good news. The rate fell because 264,000 people left the labour force, and someone who stops looking for work stops being counted as unemployed. Labour force participation dropped to 61.4 per cent, its lowest in more than five years, and the employment-to-population ratio slipped to 58.9 per cent, the weakest reading since May 2014, per BLS data reported by CNBC.
Markets took the weak print as a reason to buy, on the logic that a soft labour market pushes the Federal Reserve towards cutting rates. The S&P 500 rose 0.33 per cent to a record and the Nasdaq gained 0.86 per cent on the day, closing a week in which they added 3.6 per cent and 5.2 per cent respectively. Then, over the following two days, oil prices firmed, the 10-year Treasury yield climbed back to about 4.71 per cent and the 30-year touched 5.25 per cent, and traders went back to pricing a roughly 52 per cent chance that the Fed's next move in September is a hike, down from about 67 per cent a week earlier. Same data. Opposite conclusion, four days apart.
⚙️ How a jobs number is built, and why it changes
The monthly US jobs report is not a count. It is two surveys, and they measure different things.
The payroll figure comes from the establishment survey, which asks around 121,000 businesses and government agencies, covering roughly 631,000 worksites, how many people were on their books during the reference period. The unemployment rate comes from a separate household survey of about 60,000 households, which asks people whether they have a job and whether they are looking for one. Two samples, two questionnaires, two sets of sampling error. When they disagree, as they did in July, neither one is wrong. They are answering different questions.
Revisions are built into the design rather than being a sign of failure. The first print of any month uses only the responses that arrived by the deadline. The second and third estimates add the firms that replied late, which is why the number keeps moving for two months after publication. Because new businesses are not in the sample yet, the BLS also models jobs created by company formations and lost to closures, then corrects the whole series once a year against unemployment insurance tax records that cover nearly every job in the country. That annual correction is the big one. The preliminary benchmark revision published in September 2025 reduced the level of US employment by roughly 911,000 jobs, per the BLS.
What has changed is how thin the raw material has become. The establishment survey's response rate hovered around 60 per cent in the decade before the pandemic and has since fallen below 45 per cent, per a San Francisco Fed economic letter. Household survey participation hit 64 per cent in November 2025, its lowest in recent history, having dropped almost five percentage points in the two months following the 2025 lapse in appropriations, per Atlanta Fed research. On the inflation side, the BLS suspended price collection entirely in Buffalo, Lincoln and Provo and cut about 15 per cent of the sample in the other 72 areas it surveys, after a hiring freeze left it short of field staff. The agency's budget has fallen 19 per cent in real terms since 2009, per the American Statistical Association, and the Department of Labor's Office of Inspector General has opened a review of the collection problems.
The honest counterweight matters here. Thinner samples have not yet produced measurably worse numbers. Employment revisions since 2022 have run roughly in line with the 1990 to 2019 average, and CPI revisions have been in line with their pre-pandemic norm, per that same San Francisco Fed letter. The BLS simulation of its suspended price collection found the effect on CPI estimates was smaller than one hundredth of a percentage point. The data has not become fiction. What has happened is subtler: these numbers were always noisier than the way markets trade them, and the cushion protecting them from becoming genuinely unreliable is getting thinner while the Fed leans harder on each print. A 2026 Chicago Fed working paper puts it plainly: real-time labour indicators are noisy, get revised, and frequently send conflicting signals.
The dynamics covered in this article affect every US stock in your portfolio. Trade from India on the Winvesta app. No US bank account needed!
🚀 Join 60,000+ investors, become a paying subscriber or download the Winvesta app and fund your account to get insights like this for free!
🏆 Winners and losers when the data gets noisy
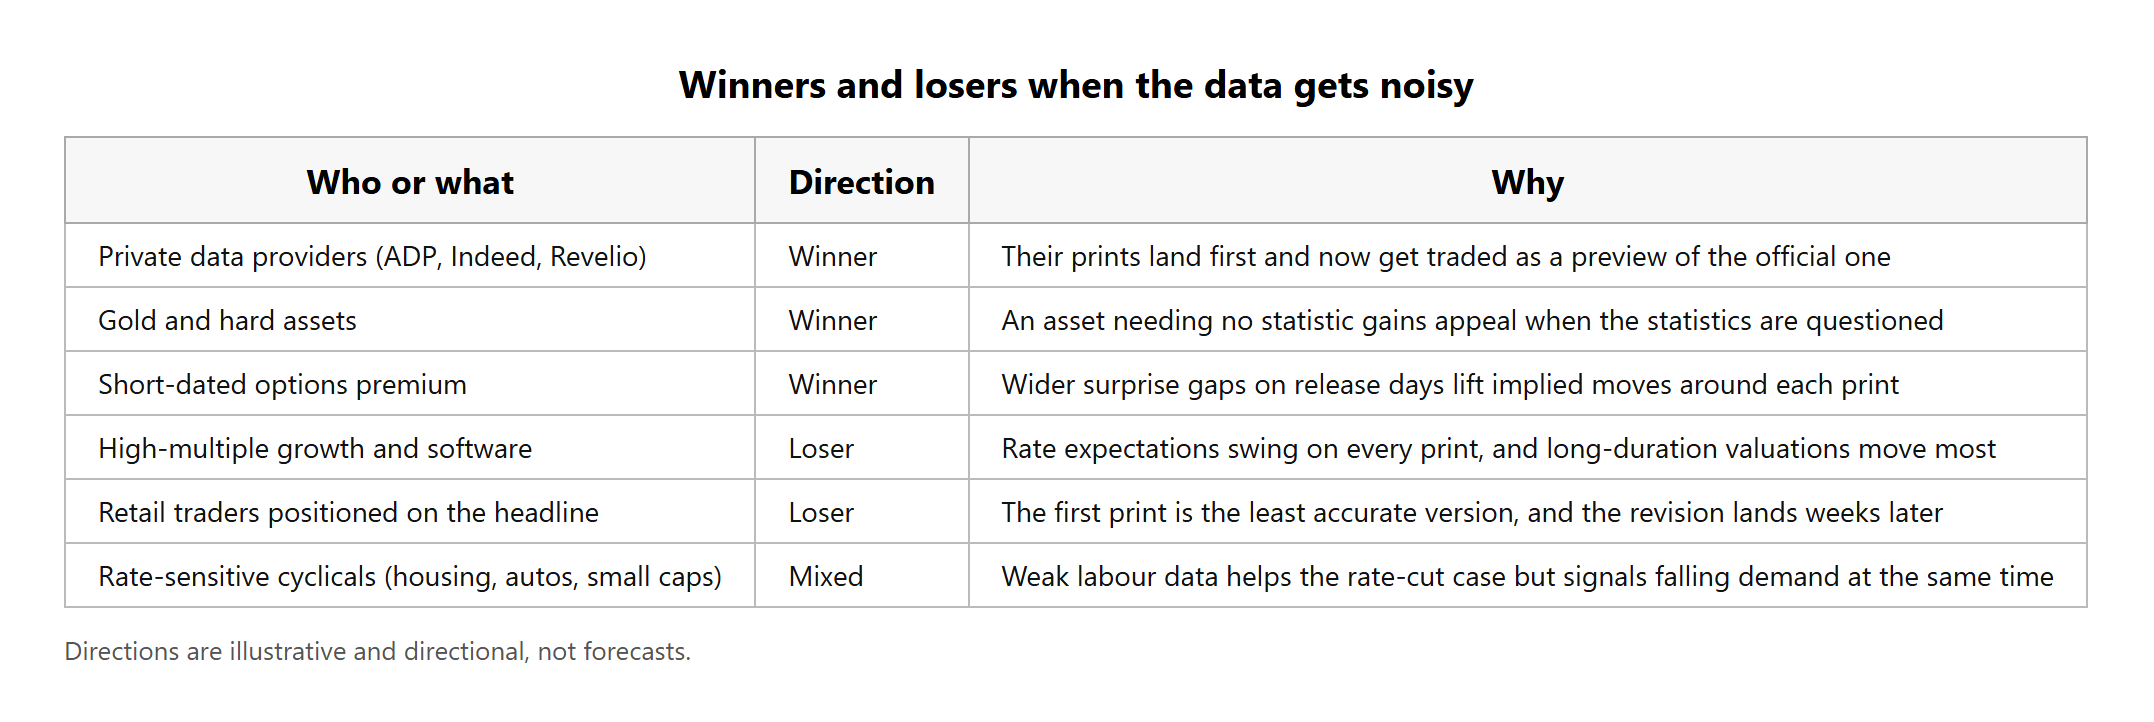
Noise is not neutral. It moves money towards some things and away from others.
Private data providers are the clearest beneficiaries. ADP's payroll report lands two days before the official one, and its readings, along with those of firms like Indeed and Revelio, now get treated as a preview rather than a footnote. CME Group research published this year finds private and official jobs data track each other well over long periods while diverging plenty month to month, which is a useful reminder that a second noisy estimate is not the same thing as confirmation.
Long-duration assets absorb the damage. Every time rate expectations swing on a print, the stocks whose value sits furthest in the future move most, which is precisely the mega-cap growth and high-multiple software that Indian retail portfolios are concentrated in. A market that flips from pricing a cut to pricing a hike inside four days is repricing your Nvidia position twice for reasons that have nothing to do with Nvidia.
Gold benefits from the same discomfort. An asset that requires no statistic to be trusted gains appeal when the statistics themselves are being questioned, which is one thread in the central bank buying of the past two years.
The table below sets out the pattern. Directions are illustrative and directional, not forecasts.
🇮🇳 What this means for Indian investors holding US equities
Start with timing, because it is structural and most Indian investors have never thought about it. The US jobs report is released at 8:30 am Eastern, which is 6 pm IST, an hour before the US market opens. You can watch the first reaction live. What you cannot watch is the correction. The revision that cut 103,000 jobs out of May and June arrived on a Friday evening five weeks later, buried inside a fresh headline, long after anyone had adjusted the position they took on the original number. If your process is to react to the print, you are systematically trading the least accurate version of every figure.
The currency layer compounds it. The rupee sits near 95.4 to the dollar, per Trading Economics, down about 8.9 per cent over twelve months though up around half a per cent in the past month. US data drives the dollar, the dollar drives your rupee returns, and the transmission runs through exactly the channel this article describes: a weak jobs print softens the dollar and trims the currency gain on your US holdings, while a hot inflation print does the opposite. Indian LRS money has been flowing into US equities at pace, rising more than 50 per cent in FY26 to roughly 2.65 billion dollars of overseas equity and debt investment, per RBI data on outward remittances. Most of that money is exposed to both effects at once and hedged against neither.
The practical response is unglamorous. Treat any single US data print as one observation with a wide error band, not as information. Three consecutive months pointing the same way is a signal; one month inside a 122,000-job confidence interval is not. If a position only makes sense because of one payroll number, it is a bet on measurement error. Systematic investing helps here in a way that has nothing to do with discipline as a virtue: a monthly SIP into US index exposure buys through the noise instead of guessing at it, and it removes the temptation to trade at 6 pm IST on a figure that will be different in October.
One thing to avoid: reading a weak labour market as a green light for high-growth tech. That logic worked on 7 August and stopped working by 10 August, when oil and yields reasserted themselves. The Fed is currently balancing a labour market that looks soft against inflation that has not gone away, and it is doing so using data it openly treats as provisional. Neither side of that trade is safe to front-run.
🔭 What to watch from here
Five things will tell you whether the fog is thickening or clearing.
Today's July CPI print is the immediate one. Consensus is for a 0.1 per cent monthly rise, taking the annual rate to about 3.4 per cent from 3.5 per cent, with core at roughly 2.5 per cent. Watch the revision to June's figure as closely as the headline.
The next preliminary benchmark revision, due in the autumn, rewrites the level of US employment for the year. Last year's took nearly a million jobs off the books. A large negative revision would confirm that the current run of monthly prints has been flattering.
Labour force participation is the number that decides whether a falling unemployment rate is good news. At 61.4 per cent and dropping, the rate is improving for the wrong reason. A rising participation rate alongside a rising jobless rate would actually be healthier.
The gap between ADP and the official payroll number is worth tracking month by month. Persistent, large divergence between them is a sign that one of the two is losing contact with what is happening.
The September FOMC meeting, with hike odds sitting near a coin flip, is where all of this gets priced. Pay attention to how much weight the statement gives to data uncertainty itself, because a Fed that says out loud it is unsure of its inputs is a Fed that moves more slowly in both directions.
If this changed how you read a US jobs headline, pass it on.
🏁 The bottom line
The July report was not a contradiction. A payroll count and an unemployment rate come from different surveys, both carry sampling error, and a jobless rate can fall because people gave up looking. Wrapped around that is a slower and more consequential story: the surveys behind the numbers your portfolio reacts to are being answered by fewer and fewer people, funded by a shrinking real budget, and revised by amounts larger than the moves markets make on the first print. The data is not broken. It is less precise than the confidence with which it gets traded, and the gap between those two things is where retail investors lose money. The fix is not better forecasting. It is refusing to let a single number with a 122,000-job error bar change what you own.
📊 By the numbers
Minus 23,000: US non-farm payroll change in July 2026, against a Dow Jones consensus of plus 83,000, per BLS data released on 7 August
103,000: jobs removed from the May and June counts in the same release, revising May down to 63,000 and June to 20,000, per the BLS
Plus or minus 122,000: the 90 per cent confidence interval on the monthly payroll change, per the BLS Employment Situation technical note
4.1 per cent: the July unemployment rate, down from 4.2 per cent, achieved as 264,000 people left the labour force, per the BLS
61.4 per cent: labour force participation in July, the lowest in more than five years, with the employment-to-population ratio at 58.9 per cent, weakest since May 2014
Below 45 per cent: the establishment survey's response rate, down from around 60 per cent in the decade before the pandemic, per a San Francisco Fed economic letter
Roughly 911,000: jobs removed from the US employment level by the preliminary benchmark revision published in September 2025, per the BLS
About 52 per cent: market-implied odds of a September Fed rate hike as of early this week, down from roughly 67 per cent a week earlier
Near 95.4: rupees per dollar on 11 August, down about 8.9 per cent over twelve months, per Trading Economics
Disclaimer: All content provided by Winvesta India Technologies Ltd. is for informational and educational purposes only and is not meant to represent trade or investment recommendations. Remember, your capital is at risk. Terms & Conditions apply.