


Most investors track the S&P 500 without understanding the force actually driving it this year. Beneath an index that set a record high in June, the sharpest rotation from growth stocks to value stocks since the dot-com era is quietly deciding who actually makes money in 2026. This article unpacks that rotation: what started it, how it works, and what it means for a portfolio built around US tech. That's why we built Winvesta Crisps: to break down what's actually moving markets, in plain language, before the consensus catches up. 60,000+ investors from all over India are already in. What about you?
🔔 Don't miss out!
Add winvestacrisps@substack.com to your email list so our updates never land in spam.
If you own US stocks from India, there is a decent chance your portfolio has felt strangely heavy this year. The S&P 500 touched a record 7,609 in early June, per S&P Dow Jones Indices, and headlines keep calling it a bull market. Yet the tech names most Indian investors actually hold, the Metas and Microsofts and Teslas of the world, have gone roughly nowhere, or worse. Most people don't realise how deep this runs. The gap between US value stocks and US growth stocks in 2026 has stretched to roughly 20 percentage points, per FTSE Russell index data, the widest styles divergence in a generation. The index is fine. The stocks inside it have swapped places. Understanding why is the difference between reading this year's market correctly and giving up on it at exactly the wrong moment.
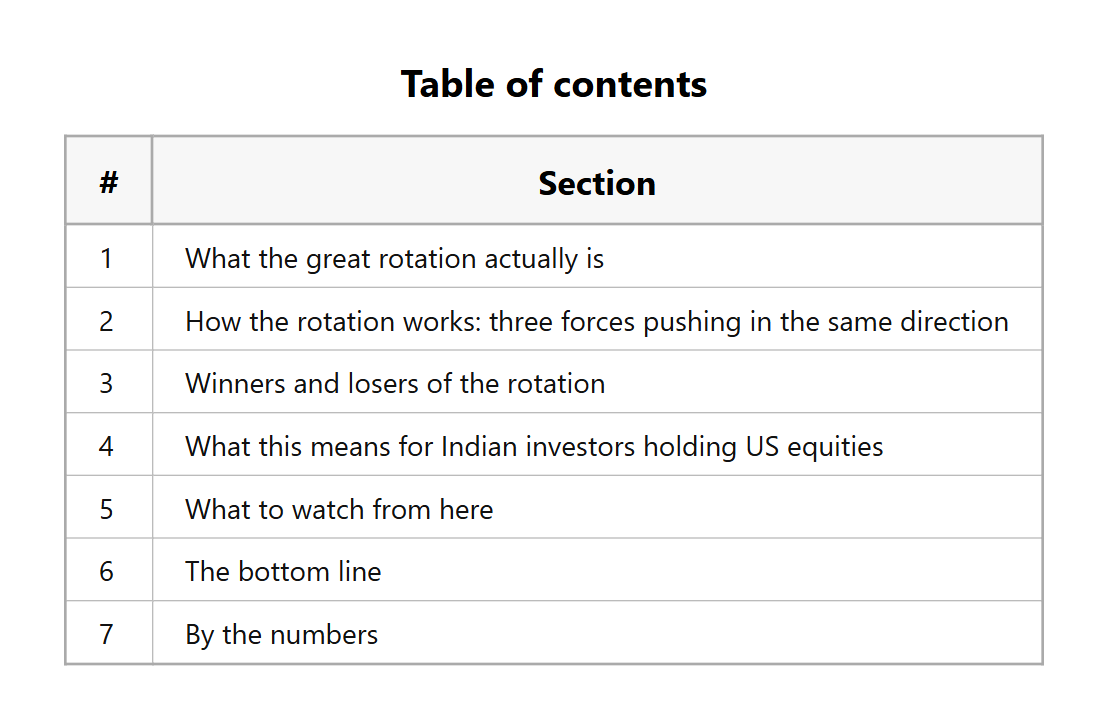
🔄 What the great rotation actually is
Every US stock sits somewhere on a spectrum between two styles. Growth stocks are companies priced for what they will earn years from now: fast expansion, high valuations, lots of the price resting on the future. Big tech dominates this camp. Value stocks are companies priced close to what they earn today: banks, energy producers, consumer staples, healthcare, industrials. Slower, cheaper, more of the price resting on the present.
For most of the past decade, growth won. The pattern reached its peak in the Magnificent Seven era of 2023 to 2025, when Apple, Microsoft, Alphabet, Amazon, Nvidia, Meta and Tesla did most of the S&P 500's heavy lifting. In 2025, a basket of those seven names returned around 23 per cent while the rest of the index managed about 16 per cent, per Roundhill ETF data. Owning anything other than mega-cap tech felt like a mistake.
2026 flipped the table. Through late July, the Russell 1000 Value index is up somewhere in the high teens to around 20 per cent for the year, while the Russell 1000 Growth index is roughly flat, per FTSE Russell data cited by State Street and several weekly market trackers. The Magnificent Seven as a group are down about 3.7 per cent this year while the other 493 stocks in the S&P 500 are up about 12.9 per cent, per Roundhill data reported by Benzinga in late July. Tesla alone has fallen roughly 29 per cent. Meanwhile energy stocks were up around 22 per cent by mid-year, per Alaric Securities' sector review, with materials and consumer staples also well ahead of the index.
This is what investors mean by the great rotation: money moving out of the expensive, future-priced part of the market and into the cheap, present-priced part. The index level hides it. The composition of returns reveals it.
One caveat before we go further. Part of value's headline outperformance this year is a labelling quirk. FTSE Russell rebuilds its style indices every June, and the 2026 reconstitution moved a chunk of big tech into the value bucket: Amazon is now classified as 92 per cent value, and technology's weight in the Russell 1000 Value index has climbed from under 4 per cent to roughly 18.6 per cent, per LSEG. So the value index is no longer purely banks and oil wells. The rotation is real, but the index labels flatter it.
⚙️ How the rotation works: three forces pushing in the same direction
Style rotations are not random mood swings. They follow a mechanism, and this one has three moving parts.
The first is interest rates, and this is the engine. A growth stock is what analysts call a long-duration asset: most of its value sits in earnings that arrive five, ten, fifteen years from now. To price those future earnings today, investors discount them using prevailing interest rates. When rates fall, distant earnings become more valuable and growth stocks fly. When rates rise, distant earnings shrink in present value and growth stocks sag. Value stocks, whose earnings arrive now, barely notice.
That is exactly the switch that flipped this year. Markets entered 2026 expecting the Federal Reserve to keep cutting rates. Then the Iran conflict erupted in February and shipping through the Strait of Hormuz, which carries roughly a fifth of the world's seaborne oil, was disrupted for weeks. Global supply lost around 10 million barrels a day at the peak, per a Dallas Fed working paper, and Brent crude spiked to around 94 dollars in March, a surge of roughly 50 per cent from the start of the year. Energy costs fed straight into inflation, pushing US headline CPI back towards 4 per cent, per Dallas Fed estimates of the shock's contribution.
The Fed responded the only way it could: it stopped talking about cuts. The federal funds rate has sat at 3.50 to 3.75 per cent since late 2025, and at the July meeting three officials dissented in favour of tighter policy, per Trading Economics. Derivatives markets now price roughly a 68 per cent chance of a rate hike in September, and Bank of America's research team expects as many as three hikes this year. The 10-year Treasury yield has climbed to around 4.7 per cent, near an 18-month high. Higher discount rates, expensive future earnings, weak growth stocks. The maths is unforgiving.
The second force is the AI spending reckoning. For two years, investors rewarded hyperscalers for pouring money into AI infrastructure. In 2026 they started asking for receipts. Combined capital expenditure at Microsoft, Meta, Alphabet and Amazon is heading towards 700 billion dollars this year, per CNBC, with projections above a trillion for 2027. Alphabet's free cash flow turned negative in the second quarter for the first time since its 2004 listing, per Fortune, and when the company raised its capex forecast by another 15 billion dollars, the stock fell more than 7 per cent in a day despite record earnings. Meta lifted its own capex range to 125 to 145 billion dollars and got a similar reception. The market has not decided AI is a bust. It has decided that spending without visible returns no longer earns a premium, and that repricing lands hardest on the most expensive stocks.
The third force is the valuation gap itself. Growth stocks entered 2026 at a trailing price-to-earnings ratio of about 39, against about 22 for value stocks, per Siblis Research, a spread last seen around the dot-com bubble. A premium that stretched needs everything to go right. Rates went wrong, capex went wrong, and the premium began to compress. Rotations feed on themselves: as value outperforms, momentum and flows chase it, and the move extends further than the fundamentals alone would justify.
The dynamics covered in this article affect every US stock in your portfolio. Trade from India on the Winvesta app. No US bank account needed!
🚀 Join 60,000+ investors, become a paying subscriber or download the Winvesta app and fund your account to get insights like this for free!
🏆 Winners and losers of the rotation
The rotation has redrawn the leaderboard sector by sector.
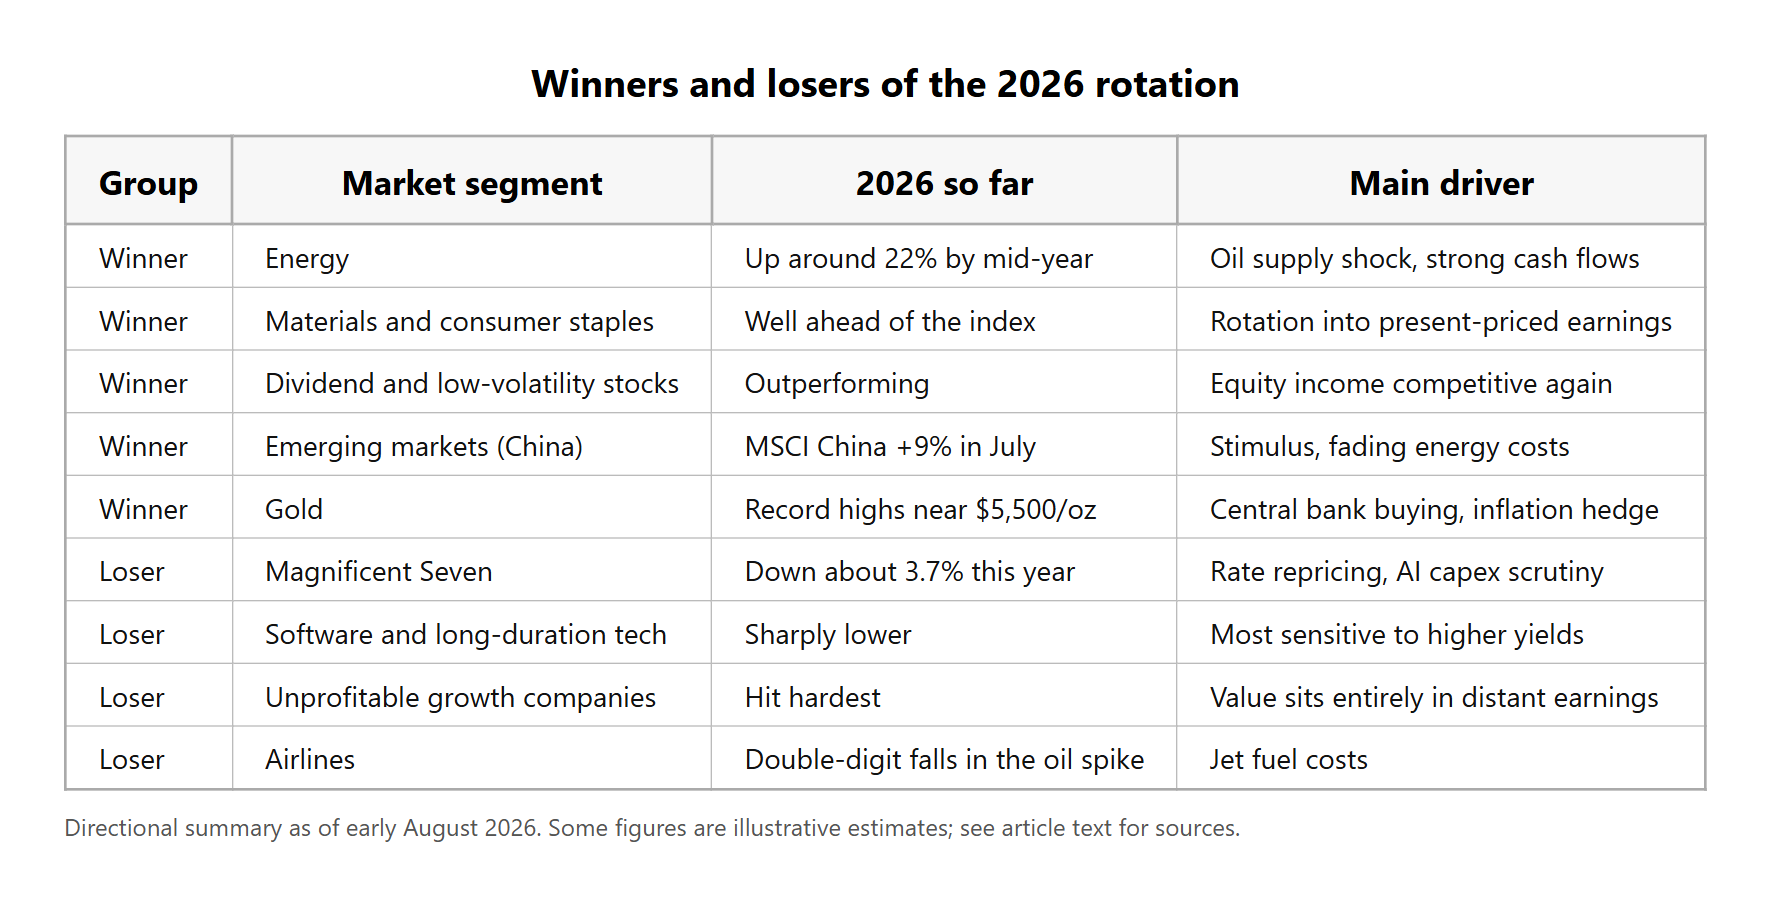
Energy is the standout winner, up around 22 per cent by mid-year per Alaric Securities, boosted first by the Hormuz supply shock and then by the earnings that followed; analysts estimated Exxon Mobil's 2026 free cash flow could top 35 billion dollars if oil held above 85 dollars. Materials and consumer staples have also beaten the index comfortably, per Yahoo Finance sector data. Dividend payers and low-volatility names, ignored through the AI boom, are back in demand as bond-like equity income becomes competitive again. Emerging markets have joined in: MSCI China gained about 9 per cent in July alone, its best month of 2026, per Clearbrook's weekly commentary, helped by domestic stimulus and fading energy costs. Gold has been the loudest winner of all, touching record levels near 5,500 dollars an ounce earlier this year, with central banks buying 289 tonnes in the second quarter, the largest quarterly addition since late 2024, per World Gold Council data.
On the losing side sit the assets that defined the last cycle. Mega-cap growth is down as a group, with Tesla the worst of the Seven. Software and other long-duration tech have been hit hardest by rising yields; unprofitable growth companies, whose entire value sits in the far future, have fared worse still. Airlines took a separate beating from fuel costs during the oil spike, with Delta and United falling by double digits, per market reports in March. The table below sums up the picture; some figures are illustrative directional estimates where precise sourcing varies.
🇮🇳 What this means for Indian investors holding US equities
Here is the uncomfortable part. Indian retail money in US markets is concentrated in exactly the corner of the market that is underperforming. RBI data on outward remittances shows overseas equity and debt investment under the LRS jumped 56 per cent to about 2.65 billion dollars in FY26, and reporting on those flows, per Business Today, shows Indian investors overwhelmingly buying the trillion-dollar names: Meta, Nvidia, Microsoft, Amazon, Tesla. If your Winvesta portfolio looks like that list, your 2026 has probably lagged the S&P 500 by a wide margin, and it is worth understanding that this is a style effect, not a stock-picking failure.
The currency has softened the blow, and this matters more than most investors appreciate. The rupee trades near 95.4 to the dollar, per Trading Economics, down roughly 9 per cent over the past year even after the RBI's defence of the currency through dollar sales and measures that attracted about 41 billion dollars of inflows. A flat US portfolio in dollar terms is still up high single digits in rupee terms over twelve months purely from the exchange rate. Currency has quietly done this year what your stocks have not. The reverse also holds: if the RBI's defence succeeds and the rupee stabilises or recovers, that cushion disappears.
The practical lesson is about concentration, not abandonment. Nobody sensible is arguing you should dump US tech; these remain extraordinary businesses with fortress balance sheets. The argument is that a portfolio which is 80 per cent mega-cap growth is making one very specific bet: that rates fall and AI capex pays off soon. Diversifying within your US exposure spreads that bet. Equal-weight S&P 500 ETFs sidestep the concentration problem entirely. Value and dividend ETFs give you the side of the market that is currently working. A small gold allocation hedges the inflation scenario that hurts growth stocks most. All of these are accessible from India through the same LRS route you already use, though remember that remittances above 10 lakh rupees in a financial year attract 20 per cent tax collected at source, adjustable against your tax liability.
Timing deserves one honest caveat. Rotations can reverse quickly. The Magnificent Seven regained around 4.8 trillion dollars of market value between April and mid-May, per The Motley Fool, which shows how violently the pendulum can swing back when rate expectations shift. Chasing whichever style just won is how retail investors get whipsawed. The point of diversification is not to catch the rotation; it is to stop needing to predict it.
🔭 What to watch from here
A handful of signals will tell you whether this rotation extends or exhausts itself.
The September Fed meeting is the big one. Markets price roughly a 68 per cent chance of a hike, per Trading Economics. A hike, or hawkish language around one, extends the pressure on growth stocks. A surprise hold with dovish guidance would likely spark a sharp growth rebound.
Monthly US inflation prints drive everything upstream of the Fed. June's CPI cooled more than expected, per CNBC, which briefly pulled yields down. A run of soft readings as the oil shock fades from the data would rebuild the case for cuts and for growth stocks with it.
The 10-year Treasury yield is the cleanest real-time gauge. Around 4.7 per cent, growth stays under pressure. A sustained move back below the low 4s would signal the discount-rate headwind easing.
Hyperscaler capex guidance and free cash flow will decide the AI side of the story. Watch whether Alphabet's cash flow recovers, whether Meta trims its spending range, and whether cloud revenue growth keeps justifying the outlay. Amazon's quarter showed spending can coexist with returns; the market wants more evidence.
Oil and the rupee round out the dashboard. Brent falling back towards pre-crisis levels removes the inflation impulse that started all this. And the rupee's path around 95 to 97 determines how much currency cushion Indian investors keep.
If this changed how you see what is happening inside the US market this year, pass it on.
🏁 The bottom line
The 2026 market is not weak. It is rearranged. An index near record highs is being carried by energy, staples, materials and dividend payers while the mega-cap tech that carried the last three years sits out, pressured by higher rates, an AI spending reckoning and a valuation premium that finally snapped back. For Indian investors, the message is specific: your likely underperformance this year is a style effect concentrated in the exact stocks LRS money crowds into, the rupee has quietly offset much of it, and the fix is not to flee US markets but to own more of them. Breadth is the trade. Concentration is the risk. That was true in 2021, it was forgotten by 2024, and 2026 is the reminder.
📊 By the numbers
Roughly 20 percentage points: the 2026 performance gap between the Russell 1000 Value and Growth indices through late July, per FTSE Russell index data
Minus 3.7 per cent vs plus 12.9 per cent: Magnificent Seven vs the other 493 S&P 500 stocks this year, per Roundhill data via Benzinga
About 39 vs 22: trailing price-to-earnings of US growth vs value stocks entering 2026, per Siblis Research, a spread last seen in the dot-com era
Around 700 billion dollars: combined 2026 capex at Microsoft, Meta, Alphabet and Amazon, per CNBC
Around 4.7 per cent: the 10-year US Treasury yield in early August, near an 18-month high, per Trading Economics
Roughly 68 per cent: market-implied odds of a September Fed rate hike, per Trading Economics
Near 95.4: rupees per dollar in early August, down about 9 per cent in a year, per Trading Economics
Plus 56 per cent: growth in Indian LRS overseas equity and debt investment in FY26, to about 2.65 billion dollars, per RBI data
Disclaimer: All content provided by Winvesta India Technologies Ltd. is for informational and educational purposes only and is not meant to represent trade or investment recommendations. Remember, your capital is at risk. Terms & Conditions apply.