


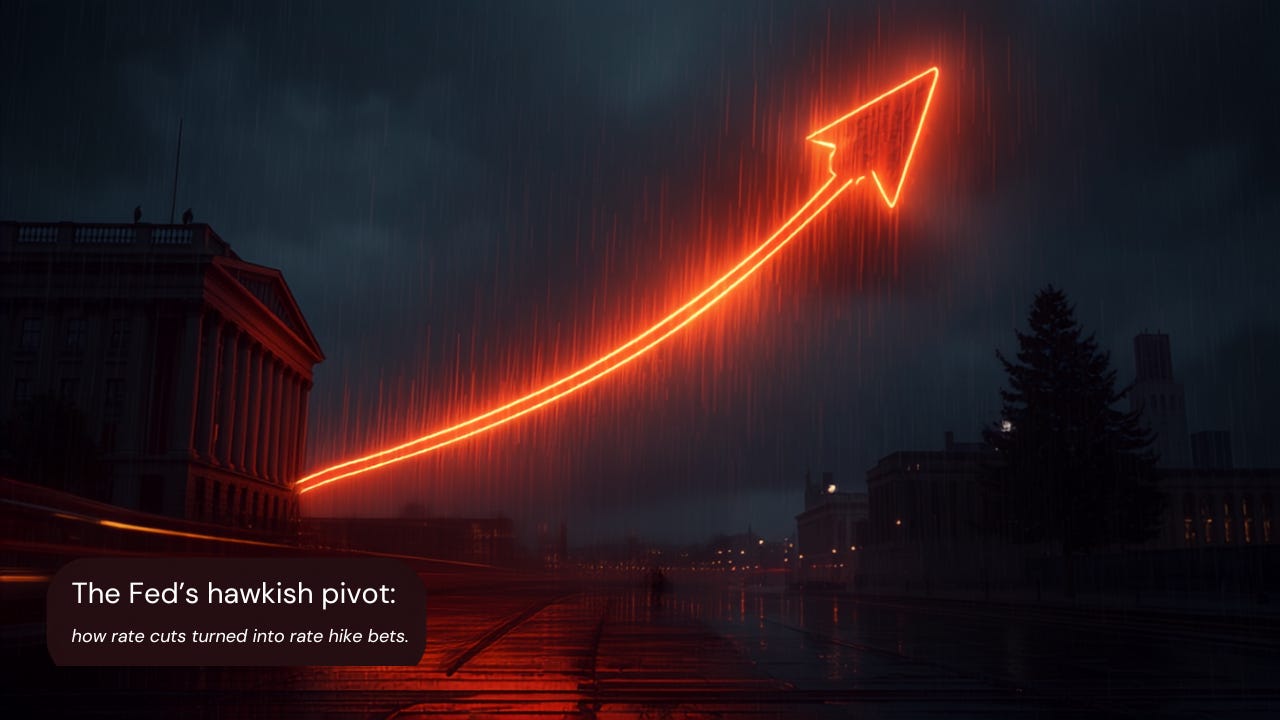
Most investors track the Fed’s rate decisions as a single headline: hike, hold, or cut. Few notice how fast that headline can flip an entire market narrative. Within about 100 days, the Fed went from a chair everyone expected to cut aggressively to a committee openly debating whether to raise rates instead, and the ripple effects are already showing up in bond yields, bank earnings, and the rupee. That’s why we built Winvesta Crisps, to break down what’s actually moving markets in plain language, before the consensus catches up. 60,000+ investors from all over India are already in. What about you?
🔔 Don’t miss out!
Add winvestacrisps@substack.com to your email list so our updates never land in spam.
In January 2026, Donald Trump nominated Kevin Warsh to run the Federal Reserve because he wanted a chair who would cut interest rates faster than Jerome Powell had. By June, Warsh’s first move as chair was to strip the Fed’s easing bias out of its policy statement entirely. By July, Bank of America was penciling in three separate rate hikes before the year is out. Nobody planned this outcome, and almost nobody called it with confidence even six months ago. It happened because a war in the Middle East pushed oil and inflation higher at the same time a new Fed chair turned out more hawkish than his resume suggested, and a labor market that refuses to fully break gave him room to act on it. If you hold US equities from India, this is not background noise. It is one of the biggest swing factors for how every dollar you’ve invested performs over the next six months, in both dollar and rupee terms.
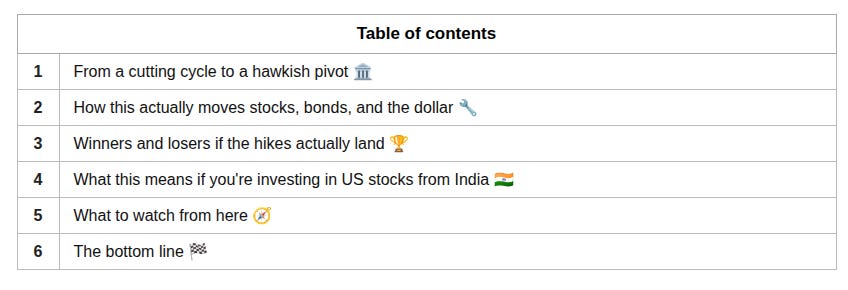
🏛️ From a cutting cycle to a hawkish pivot
For most of 2024 and 2025, the Fed’s story was simple: rates were coming down. It cut three times between September and December 2024, paused through the first eight months of 2025 to see how Trump’s tariffs would feed into prices, then cut three more times between September and December 2025 as the labor market cooled. By the end of 2025, the federal funds rate sat at 3.50% to 3.75%, and the market’s working assumption was that 2026 would bring one, maybe two, more cuts.
Then the succession question arrived. Powell’s term as chair was due to end in May 2026, and in January, Trump nominated Kevin Warsh, a former Fed governor known in 2008 and 2009 for worrying more about inflation than jobs, to replace him. The irony is that Trump wanted Warsh specifically because Warsh had spent the prior year arguing for lower rates and had pointed to AI-driven productivity gains as a reason the Fed could afford to cut. Markets, however, remembered his older track record. The nomination alone sent Treasury yields higher, strengthened the dollar, and knocked gold down sharply in a single session, on the assumption that a Warsh Fed would ultimately behave like a hawk, whatever he said on the campaign trail for the job.
Before Warsh even took office, the backdrop shifted again. On 28 February 2026, the US and Israel launched strikes on Iran, and the conflict spread quickly into the Strait of Hormuz, the corridor that carries roughly a fifth of the world’s seaborne oil. Iran restricted shipping through the strait, oil prices jumped, and headline US inflation climbed to a three-year high. The Fed, still under Powell at its March meeting, held rates steady and kept one projected cut for 2026 on its dot plot, but the direction of travel was already less certain than it had looked in December.
Warsh was confirmed by the narrowest Senate vote for a Fed chair in history and was sworn in on 22 May 2026. His first meeting, on 17 June, was the moment the story flipped. The Fed held rates steady for a fourth consecutive meeting, as expected. What markets didn’t expect was how it said it. The post-meeting statement ran to roughly 130 words, a fraction of the length Powell’s Fed typically used, and it dropped the language that had signaled an eventual cut. The updated dot plot told the real story: nine of eighteen officials now projected at least one rate hike by the end of 2026, and the median year-end rate projection jumped from a range of 3.25% to 3.75% in March to 3.6% to 4.1% in June. The 2-year Treasury yield, the part of the curve most sensitive to near-term Fed moves, jumped roughly 14 basis points on the day. In an unusual footnote, Powell himself stayed on the Fed’s Board of Governors after his term as chair ended and voted alongside Warsh to hold rates, a reminder that this wasn’t one person’s call.
Since then, the picture has stayed genuinely unsettled rather than resolving in one direction. US headline CPI hit 4.2% in May, a three-year high driven mostly by post-war oil prices, even as core measures stripping out food and energy stayed more moderate. Job growth had been running at a healthy clip through the spring, but June’s report showed a sharp slowdown to just 57,000 new jobs, with unemployment ticking up to 4.2%. Then, in early July, the fragile Iran ceasefire broke down again: renewed strikes, attacks on tankers in the Strait of Hormuz, and a fresh US blockade threat sent oil and Treasury yields higher once more, only for a cooler-than-expected June CPI print on 14 July to pull some of that back. Every one of these data points has been moving the odds of a hike around by the day.
🔧 How this actually moves stocks, bonds, and the dollar
A rate decision doesn’t just change what banks charge each other overnight. It resets the math behind almost every asset you own through a few connected channels.
The clearest is the discount rate effect on equities. A stock’s value is, in theory, the sum of all the cash it will earn in the future, discounted back to today. When the Fed signals higher rates for longer, that discount rate rises, and the present value of far-off earnings shrinks. This hits high-multiple growth and AI-linked stocks hardest, since a large share of their value sits in profits expected years from now, while it barely touches a company whose earnings are already large and near-term. You can see this playing out in real time: chip and AI-infrastructure names have been swinging several percent in a single session depending on whether that day’s inflation print or Fed commentary reads as hawkish or dovish, while more defensive sectors have moved far less.
Bonds work through simple arithmetic: prices and yields move in opposite directions. If the Fed hikes, or even just signals hikes are more likely, yields on new bonds rise, and existing bonds paying a lower fixed rate become less attractive, so their prices fall. The 10-year Treasury yield has climbed to around 4.6% and the 2-year to around 4.2% in mid-July, both near two-month highs, as the market has repriced the odds of a September hike from roughly a quarter to, on some days, over 70%, swinging back and forth with each new headline out of the Middle East.
Currencies move through interest rate differentials. Higher US rates, relative to what other major central banks are offering, make dollar assets more attractive to global capital, which tends to pull the dollar higher against other currencies, the rupee included. That single mechanism is the direct link between what happens in Washington and what your US portfolio is worth when you eventually convert it back to rupees, which we’ll come back to below.
History offers a useful, if uncomfortable, precedent for why the surprise matters more than the size of the move. In February 1994, the Fed under Alan Greenspan raised its policy rate by just 25 basis points, from 3% to 3.25%, the first hike since 1989. It was a small move, but markets had spent the prior year anchored on the assumption that rates would stay low, so the shift, small as it was, triggered what’s still remembered as the “Great Bond Massacre.” The 30-year Treasury yield rose from around 6.2% to nearly 8% within nine months, and bond investors globally lost several hundred billion dollars, by some estimates over a trillion, as the Fed kept hiking through the year to 5.5%, then to 6% by early 1995. The lesson that’s held up since is that markets can absorb almost any rate path if it’s well telegraphed in advance; what actually causes damage is the gap between what was priced in and what the central bank delivers. Currently, that gap is precisely what’s opened up: a market that spent late 2025 pricing continued cuts is having to reprice for the possibility of hikes instead, in real time, mid-cycle.
The dynamics covered in this article affect every US stock in your portfolio. Trade from India on the Winvesta app. No US bank account needed!
🚀 Join 60,000+ investors, become a paying subscriber, or download the Winvesta app and fund your account to get insights like this for free!
🏆 Winners and losers if the hikes actually land
Not every part of the market reacts to a hawkish Fed the same way, and the current earnings season is already showing the split.
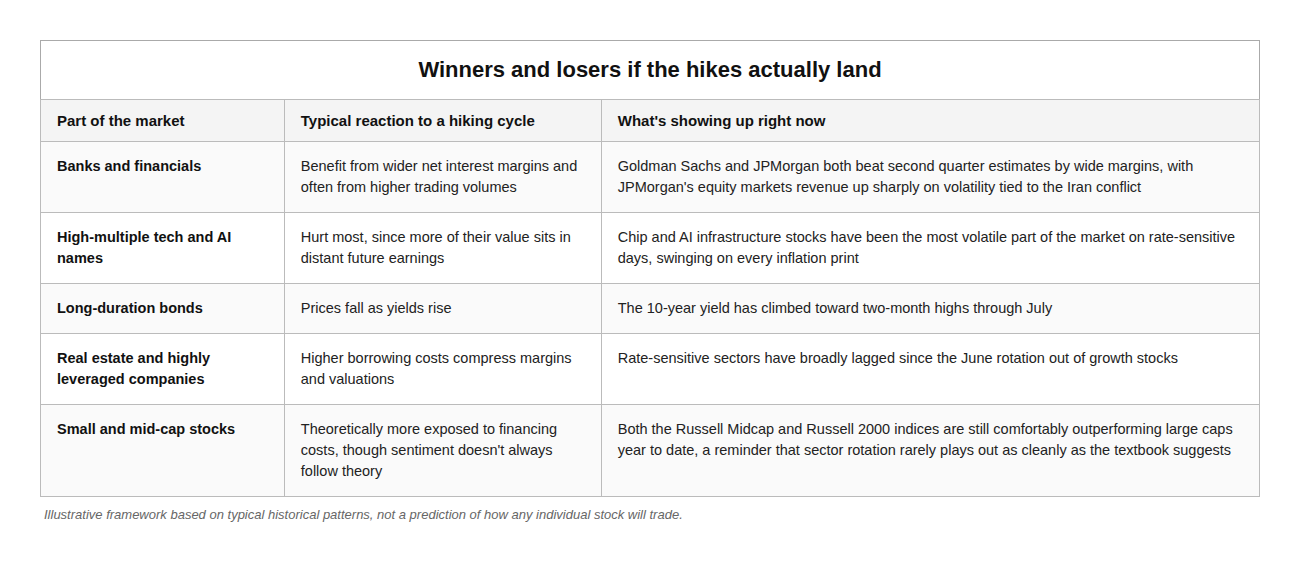
Actual outcomes depend on how much of a hike is already priced in by the time it happens.
The broader rotation since June has favored financials, healthcare, and industrials over technology, even though tech remains up meaningfully for the year overall. That’s consistent with what higher-for-longer rate expectations usually do to a market: it doesn’t necessarily mean stocks fall; it means leadership changes.
🇮🇳 What this means if you’re investing in US stocks from India

A hawkish Fed reaches your portfolio through a channel that has nothing to do with which stocks you own: the rupee.
Higher US rates, relative to India’s, tend to strengthen the dollar, and that’s exactly what’s been happening. USD/INR touched an all-time high of roughly 96.84 in May 2026 and has stayed close to that level since, trading around 96 through mid-July as renewed Middle East tensions and hawkish Fed commentary have kept the dollar firm. The Reserve Bank of India has been selling dollars through state-run banks to slow the rupee’s slide, and corporate hedging activity hit a record in June as importers and exporters alike tried to lock in rates ahead of more volatility.
This cuts in two different directions depending on where you sit. If you already hold US equities bought with rupees converted earlier, a stronger dollar means each dollar of gains is worth more in rupees when you eventually sell and bring the money home, a partial offset if the equity side of your position takes a hit from a genuine rate hike. But if you’re building a new US position now, buying dollars to invest gets more expensive in rupee terms, since your rupees simply buy fewer dollars at 96 than they did at 90.
The Reserve Bank of India is, in its own way, stuck in a version of the same bind as the Fed. India’s own retail inflation accelerated to an 18-month high in June, driven by the same oil price pressure coming out of the Strait of Hormuz, which has left the RBI holding its repo rate at 5.25% for a third consecutive meeting, in a “neutral” stance, after 125 basis points of cuts through 2025. A weaker rupee raises the cost of imported oil in rupee terms, which feeds back into Indian inflation, which gives the RBI less room to cut even if it wanted to support growth. Both central banks are, right now, being pushed toward caution by the same energy shock.
The practical takeaway isn’t to time your remittances around every Fed headline, since nobody does that reliably. It’s to be aware that the currency leg of your US investment is not a fixed exchange rate you can ignore. If you’re planning a lump sum transfer under the Liberalised Remittance Scheme in the near term, a materially weaker rupee changes the effective entry price of every dollar you deploy, independent of what the underlying stock does.
🧭 What to watch from here

A handful of dates and data points will tell you more than the daily headlines.
The July 28-29 FOMC meeting doesn’t come with updated economic projections, so the real signal will be in the statement’s language and Warsh’s press conference tone, not necessarily a policy change. The bigger event is the September 16-17 meeting, which does carry a fresh dot plot and is the point by which several banks expect the first actual hike, if one comes at all. Between now and then, every monthly CPI and PPI release matters more than usual, since the entire debate hinges on whether the current inflation spike is a temporary, war-driven energy shock or something stickier.
Oil itself is arguably the single cleanest leading indicator right now. Strait of Hormuz shipping volumes and Brent crude prices are moving almost daily with the state of the Iran ceasefire, and every spike has fed directly into Treasury yields and rate hike odds within hours. Warsh has also launched five internal task forces, including one reassessing how the Fed measures inflation itself, potentially moving toward a “trimmed mean” approach that strips out more volatile price swings. If adopted, that alone could make inflation look closer to target without a single rate move, which is worth watching as a wildcard.
For a fast read on what the market is pricing in without checking the news every hour, the 2-year Treasury yield is the cleanest single number to watch. It moves before headline commentary catches up, and it’s already told most of this story before the words did.
If this changed how you see the Fed’s next move, pass it on.
🏁 The bottom line

A Fed chair who was picked to cut rates faster is currently signaling the opposite, and the reason has less to do with any single decision than with a war-driven oil shock landing on top of an economy that hadn’t fully cooled. That combination has taken the Fed’s own committee from projecting one more cut in March to nine of eighteen members projecting a hike by June, and market-implied odds have been swinging by double digits within the same week ever since.
None of this means a hike is certain, and the same data that pushed odds up in early July pulled them back down within days when inflation came in cooler than expected. What it does mean is that the easy assumption many investors were carrying into 2026, that rates only had one direction left to go, is no longer safe to hold. For a portfolio built around US equities, that shows up as sharper rotations between growth and value, more volatile bond yields, and a dollar that’s firmer than the “de-dollarization” story many were tracking earlier this year would have suggested. For an Indian investor, it shows up most directly in a rupee that’s sitting close to its weakest level on record.
The useful habit here isn’t predicting the next FOMC decision. It’s understanding why the range of outcomes widened so much in such a short window, so that whichever way it breaks, you’re not caught assuming the old, simpler story still holds.
📊 By the numbers
3.50% to 3.75%: the federal funds rate range, unchanged since the Fed’s last cut in December 2025
9 of 18 FOMC members are projecting at least one rate hike by the end of 2026, per the June dot plot, up from a single projected cut in March.
4.2%: US headline CPI in May 2026, a three-year high, driven largely by post-war oil prices
Roughly 96: USD/INR through mid-July 2026, within striking distance of its all-time high of 96.84 set in May
5.25%: the RBI’s repo rate, held for a third straight meeting as India’s own inflation accelerates
25% to over 70%: the range in market-implied odds of a September Fed hike over just the first two weeks of July, a measure of how fast sentiment has been swinging
Several hundred billion dollars: estimated global bond market losses in 1994’s “Great Bond Massacre,” the last time a small Fed move caught markets this off guard
July 28-29 and September 16-17: the next two FOMC meetings, the second carrying updated rate projections
All figures are directional and sourced from Federal Reserve communications, CME FedWatch data, and contemporaneous market reporting as of mid-July 2026. Individual data points may shift with incoming releases.
Disclaimer: All content provided by Winvesta India Technologies Ltd. is for informational and educational purposes only and is not meant to represent trade or investment recommendations. Remember, your capital is at risk. Terms & Conditions apply.