


On 17 September the Federal Reserve's own economists projected interest rates sitting at 4.1 per cent at the end of 2027, exactly where they see this year closing, and a full half a point above the 3.6 per cent path the Fed itself had pencilled in as recently as June. Four days later the Nasdaq closed at a record and the market's own fear gauge sat near a cycle low. That is not how a hawkish surprise used to land. It is the first real test of a Fed chair who has spent four months dismantling the tool that used to make surprises like this move markets. That's why we built Winvesta Crisps: to break down what's actually moving markets, in plain language, before the consensus catches up. 60,000+ investors from all over India are already in. What about you?
🔔 Don't miss out!
Add winvestacrisps@substack.com to your email list so our updates never land in spam.
The Federal Reserve raised its benchmark rate by 25 basis points to 3.75 to 4.00 per cent on 16 September, its first increase since 2023, on a unanimous 12 to 0 vote. Nothing about that alone was strange. What was strange sat inside the accompanying projections: the median official now sees rates ending 2027 at the same 4.1 per cent as 2026, not the 3.6 per cent easing path the Fed had shown in June. Bond desks call that a duration shock, a higher-for-longer signal, as opposed to a decision shock, one more hike this year. Five trading days later the S&P 500 gained 1.5 per cent to 7,764.70, the Dow rose 0.7 per cent to 52,048.83, and the Nasdaq closed at a record. Working out why a signal that size stopped moving prices the way it should have is this week's story, and it starts with the Fed chair who has spent this year quietly turning off the microphone.
🔮 The Fed chair who decided not to tell you what happens next
Every Fed chair for two decades has used some version of forward guidance: language in the policy statement, the dot plot, or a press conference line that tells markets roughly where rates are headed before the Fed actually moves them there. Kevin Warsh, confirmed as Fed chair on 22 May 2026, has spent his first year in the job taking that tool apart.
Starting with the June 2026 meeting, Warsh's FOMC statements dropped the forward-looking signal language altogether in favour of what reporters at the time called a just-the-facts read of the decision, no promise attached to what comes next. At the Jackson Hole symposium on 28 August he went further, committing to a quieter Fed and reaffirming the 2 per cent inflation target while arguing that forward guidance boxes a central bank into decisions it later has to walk back. He has since launched five internal task forces to review how the Fed communicates, how it manages its balance sheet, which data it relies on, and how it frames its inflation goal.
The balance sheet is the other half of the shift. Warsh has said publicly that shrinking the Fed's roughly 6.7 trillion dollar balance sheet is a priority tool, one he considers more useful than jawboning about the future path of rates. In practice that reduction has stalled: after falling to about 6.54 trillion dollars in late 2025, the balance sheet has been growing again since the start of this year. The rhetoric points one way, the actual lever has not moved much yet, and that gap matters for how much weight markets should put on anything the Fed says about its intentions right now.
⚙️ What breaks when a central bank stops promising
The rate the Fed actually sets, the overnight funds rate, is one number. What moves your portfolio is the entire yield curve and the multiple the market pays for future earnings, and both of those are forward-looking. A stock priced on cash flows five years out is really priced on where the market expects rates to sit over those five years, not on today's funds rate alone. Forward guidance let a central bank move that whole curve, and every asset priced off it, without lifting the funds rate at all. A single sentence promising low rates for an extended period did the work a dozen rate moves would otherwise have taken.
Take that promise away and the dot plot becomes something else entirely. The quarterly Summary of Economic Projections still exists, an anonymous median of what individual officials expect the rate to be, but Warsh has explicitly downplayed it as a commitment. A dot plot with no promise attached to it is a survey, not a policy. Markets can still read it, but they cannot trade it with the same confidence they once traded an explicit guidance sentence, because nobody at the Fed has said the path will actually hold.
That is the mechanism behind this week's disconnect. The September dot plot was hawkish on paper: 16 of 18 officials pencilled in at least one further hike this year, and the 2027 median stopped easing altogether. A shift that size, delivered as explicit guidance five years ago, would have repriced every long-duration asset within the hour. Instead the CBOE Volatility Index sat at 14.81 into decision week, close to a cycle low, and the market absorbed the hike and the hawkish path within four trading sessions without a drawdown. Part of that is the guidance vacuum: investors are discounting the SEP's signalling value more heavily than they used to discount an explicit statement line. Part of it is separate and simpler, and a U.S. Bank Asset Management strategist put it plainly this week: solid corporate earnings and the productivity gains investors expect from AI deployment are, for now, outweighing the drag from higher rates in how the market prices equities.
History offers a caution against reading too much into four calm days either way. Across six tightening cycles since 1994, the S&P 500 has fallen an average of roughly 4 per cent in the six weeks after the first hike of a cycle before recovering those losses over the following five to six weeks. Twelve months out the average gain has been 6.7 per cent, with a median closer to 10.7 per cent, and returns were positive in every cycle bar one. The point is not that this time is safe because the market shrugged on day one. It is that markets have always needed a few months to actually price a new hiking cycle, and this cycle removed the one tool that used to tell them, in advance, roughly how far that cycle would run.
The dynamics covered in this article affect every US stock in your portfolio. Trade from India on the Winvesta app. No US bank account needed!
🚀 Join 60,000+ investors, become a paying subscriber or download the Winvesta app and fund your account to get insights like this for free!
🏆 Who higher for longer helps, and who it doesn't
A rate path that stays near 4 per cent through 2027 rather than easing back toward 3.6 per cent does not affect every corner of a portfolio the same way. The table below sketches the split, and it is an editorial read of the mechanics, not a forecast.
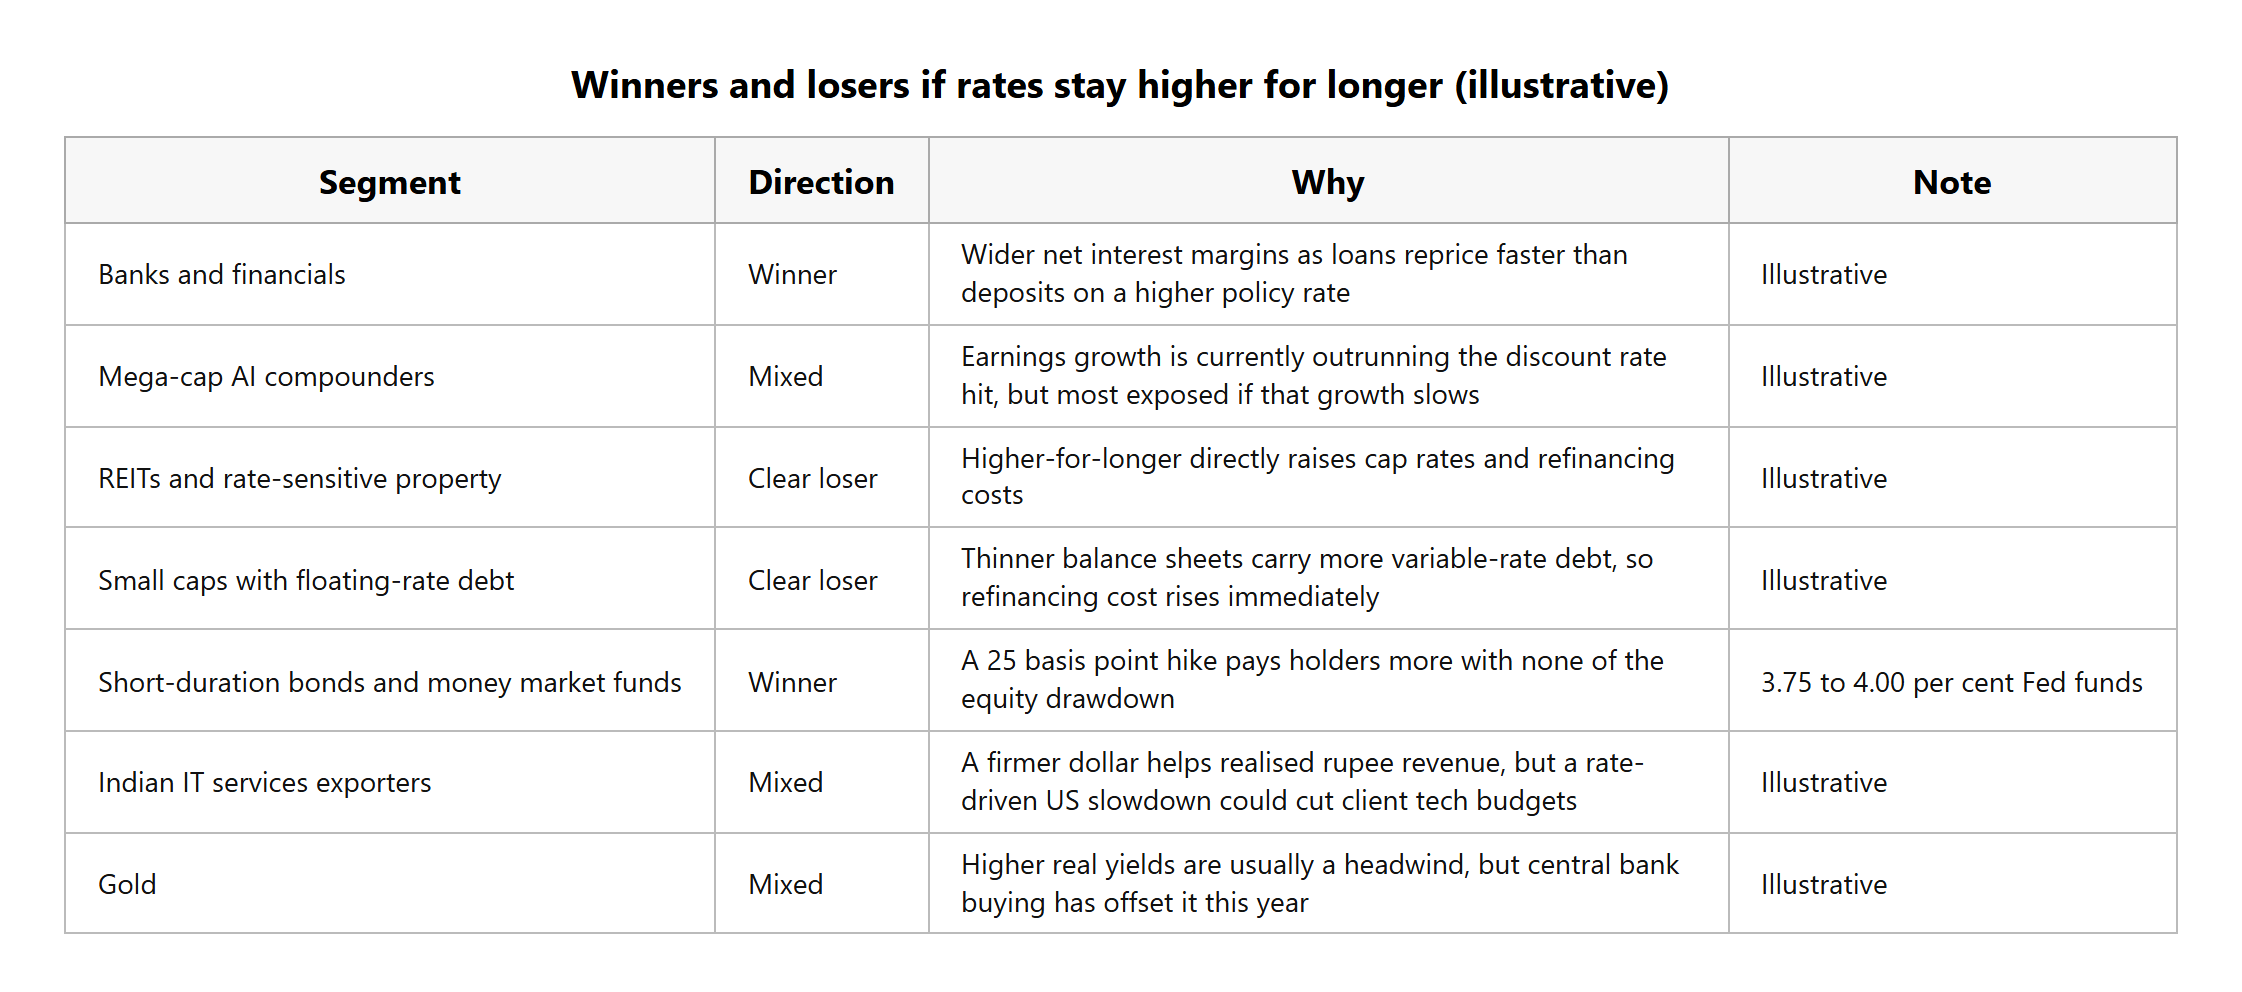
The uncomfortable middle bucket is the mega-cap AI names carrying the market. Their earnings are currently growing fast enough to absorb a higher discount rate, which is the U.S. Bank strategist's argument for why stocks shrugged this week. That is a statement about current earnings momentum, not a permanent exemption from what higher-for-longer normally does to long-duration valuations.
🇮🇳 What this means for an Indian investor holding US equities
Start with the currency, because a hiking Fed and a hawkish rate path change the maths on every dollar of US equity exposure an Indian investor holds. The rupee traded at 95.71 to the dollar on 23 September, essentially flat over the past month but down 7.81 per cent over the past twelve. A Fed that holds rates higher for longer widens the gap between US and Indian yields, which is generally rupee-negative pressure, working against the currency tailwind that boosted rupee returns on US portfolios earlier in the cycle.
The Reserve Bank of India has been actively managing the other side of that. Reserves stood at a record 785.7 billion dollars as of 11 September, lifted in part by roughly 133 billion dollars raised through a diaspora deposit scheme launched earlier this year, alongside state-run bank dollar sales and RBI spot and swap intervention. That defence has a cost and a limit, and it is happening at the same time foreign investors have been net sellers of Indian equities, pulling out 1.81 billion dollars in September and 25.87 billion dollars so far in 2026. None of that is really about the Fed's forward guidance decision specifically. It is the backdrop an Indian investor is running US equity exposure against while that decision plays out.
The second point is about what to do with the information itself. Indian investors have historically leaned on Fed communication, dot plots, guidance language, press conference wording, to time entries into US equities around rate decisions. A Fed that has deliberately made that signal less reliable is not a reason to stop watching the data. It is a reason to weight the Fed's own words less and the balance sheet and the incoming inflation and jobs prints more, since those are the levers Warsh has said he actually intends to use.
🔭 What to watch
Five things, each checkable without needing to trade around a Fed speech.
The five internal task forces Warsh launched on communications, the balance sheet, data reliance and the inflation framework. Their conclusions, whenever they land, will say more about how the Fed intends to talk to markets going forward than any single statement between now and then.
Whether the balance sheet actually starts shrinking again. It fell to roughly 6.54 trillion dollars in late 2025 and has been growing since, despite Warsh's stated preference for the balance sheet over rate guidance as his primary tool. A renewed contraction would be the first sign that rhetoric and action are lining up.
The December Summary of Economic Projections. If the 2027 median holds at 4.1 per cent or rises further, the duration shock this article describes is confirmed as a trend rather than a one-off. A move back toward easing would say the September shift was noise.
Hyperscaler capital spending guidance in the late October earnings round. The U.S. Bank argument for why equities shrugged this week rests on AI-driven earnings growth outrunning the rate headwind. That argument stands or falls on the next round of capex and revenue guidance from the companies actually spending the money.
The VIX itself. It sat at 14.81 heading into a hawkish decision. A sustained move higher from here, without a fresh shock to explain it, would suggest the market is starting to price the guidance vacuum rather than ignore it.
If this changed how you read the next Fed statement, pass it on.
🏁 The bottom line
A Fed chair who does not want to promise anything about the future path of rates has made every dot plot, every statement and every press conference line worth less than it used to be as a trading signal. That is a deliberate choice by Kevin Warsh, not a market accident, and this week was the first time markets were handed a genuinely hawkish shift under that new regime and largely shrugged it off within days.
The shrug does not mean the shift was harmless. It means the cost of a rate path that stays near 4 per cent for two more years than the Fed itself expected in June has not been priced into equities yet, either because investors do not fully believe the dots, or because AI-driven earnings are currently strong enough to absorb it, or both. Either way, an Indian investor holding US equities is now running that exposure with one fewer tool for reading what the Fed intends to do next, at exactly the moment the rate path got both higher and longer.
The practical response is not to trade the next FOMC statement for a signal it was designed not to give. It is to watch the balance sheet, the incoming data and the earnings that are supposedly justifying today's valuations, because those are the inputs actually driving where rates and equity prices go from here.
📊 By the numbers
3.75 to 4.00 per cent: the Fed funds target range after the 16 September hike, a unanimous 12 to 0 vote and the first increase since 2023
4.1 per cent: the median SEP projection for both 2026 and 2027 year-end, versus 3.8 per cent and 3.6 per cent respectively projected in June, the duration shock behind this week's move
16 of 18: Fed officials who pencilled in at least one further hike before the end of 2026
14.81: the VIX close on 18 September heading into decision week, near a cycle low despite the hawkish shift
7,764.70, 52,048.83: where the S&P 500 and Dow closed on 21 September, with the Nasdaq closing at a record the same session
4.97 per cent: the 10-year Treasury yield on 22 September
95.71: the rupee to the dollar on 23 September, down 7.81 per cent over twelve months but broadly flat over the past month
785.7 billion dollars: RBI foreign exchange reserves as of 11 September, a record, supported by roughly 133 billion dollars raised through a diaspora deposit scheme
25.87 billion dollars: net foreign investor selling of Indian equities so far in 2026, including 1.81 billion dollars in September alone
Disclaimer: All content provided by Winvesta India Technologies Ltd. is for informational and educational purposes only and is not meant to represent trade or investment recommendations. Remember, your capital is at risk. Terms & Conditions apply. Sector impact figures in this article are illustrative editorial models, not reported or verified data.