

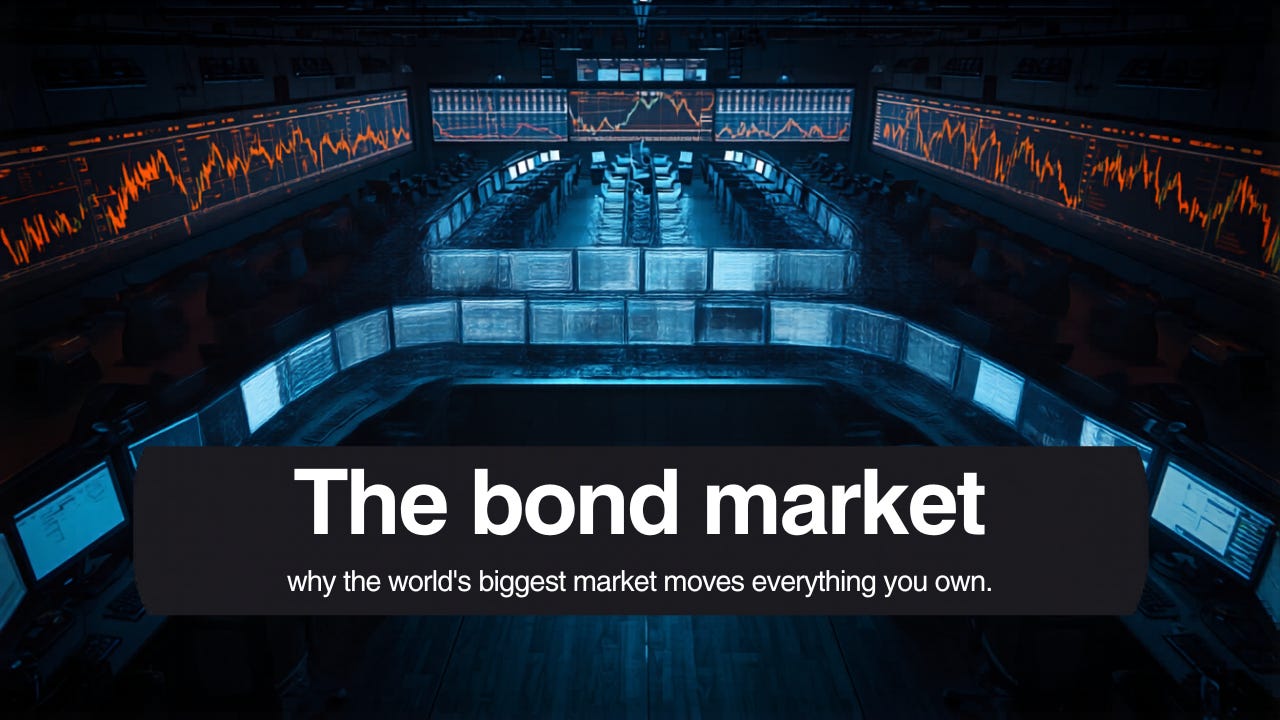
The bond market: Why the world’s biggest market moves everything you own

Most investors watch interest rates without understanding what actually sets them. They see the Fed make a decision and watch their stocks move, but the mechanism in between -- the $127 trillion global bond market -- is a black box. Right now, with the S&P 500 closing at a record 7,609.78 on June 2, 2026 -- its first close above 7,600, per TheStreet -- while the 10-year Treasury yield sits stubbornly above 4.4%, the Fed frozen on rates, and a jobs report coming Friday that could reprice everything, that black box is the most important thing in markets. Understanding how it works is the edge most retail investors will never bother to build.
That’s why we built Winvesta Crisps -- to break down what’s actually moving markets, in plain language, before the consensus catches up. 60,000+ investors from all over India are already in. What about you?
🔔 Don’t miss out!
Add winvestacrisps@substack.com to your email list so our updates never land in spam.
Bond markets move in silence. No opening bell, no ticker scrolling across a screen, no dramatic moment when a trade goes through. And yet, the bond market is larger than all the stock markets on earth combined. It sets the price of your mortgage, the rate your government pays to borrow, the discount rate applied to every company’s future earnings, and -- if you’re an Indian investor holding US equities -- the invisible variable amplifying or compressing every dollar of return you take home.
This week, the bond market is in the middle of a story that every investor needs to follow. The US 10-year yield is sitting around 4.46%, the Fed has held rates steady due to inflation running well above target -- CPI hit 3.8% year-on-year in April 2026, per the BLS, while PCE rose to 3.8% in April, per the BEA -- and Friday’s nonfarm payrolls report has the potential to reprice everything in a single afternoon. Understanding what bonds are, how they work, and why they run the world is not optional context anymore. It is the foundational literacy that separates investors who understand what’s happening from those reacting to headlines they can’t decode.
🏛️ What bonds actually are, and why they exist

At its most basic, a bond is a loan. When a government or company needs money, it can either issue shares (equity) or borrow (debt). Borrowing through the bond market means issuing a bond -- a promise to pay back the principal on a set date, with regular interest payments (called coupons) along the way.
The US federal government issues Treasury bonds to fund its deficits. Corporations issue bonds to finance expansions, buybacks, and acquisitions. Municipalities issue bonds to build infrastructure. The global bond market, valued at around $127 trillion in 2026 per Mordor Intelligence, dwarfs the global equity market. The US dollar bond market alone has grown from roughly $14.6 trillion in 2000 to over $60 trillion by mid-2025, per Bloomberg index data.
There are a few key types worth knowing:
Treasury bonds (US government debt): The benchmark. The US government currently carries approximately $38.9-39.0 trillion in total national debt, per the US Treasury. CBO projects the full-year FY2026 deficit at $1.9 trillion -- the highest since the pandemic era. Every dollar of that deficit requires a new bond sale.
Investment-grade corporate bonds: Debt issued by financially solid companies -- think Apple, Microsoft, JPMorgan. Lower yields than junk, but more than Treasuries.
High-yield bonds (junk bonds): Issued by riskier borrowers. Higher yields to compensate for higher default risk. These are the canary in the coal mine for credit stress -- watch spreads here when the economy wobbles.
Mortgage-backed securities (MBS): Bundles of home loans sold as bonds. The Fed owns trillions of these. They’re directly connected to your mortgage rate.
The bond market is also deeply global. Sovereign governments from Japan to Germany to India issue bonds. Foreign central banks, pension funds, insurance companies, and sovereign wealth funds from across the world hold US Treasuries as their core reserve asset.
⚙️ How bond mechanics actually work -- yields, prices, and duration
This is the part most people skip, and it’s the reason bond market movements feel opaque. One core rule governs almost everything:
Bond prices and yields move in opposite directions.
Here’s why. Say you buy a 10-year Treasury bond at $1,000, paying a 4% annual coupon -- $40 per year. Now imagine interest rates rise. New bonds are issued at 5% -- $50 per year. Your old bond paying $40 is now less attractive. Its price falls until its effective yield matches the new 5% market rate. The math works the other way too: if rates fall, your 4% bond becomes more valuable because new bonds pay less. Its price rises.
This inverse relationship has one critical implication: rising interest rates are bad for existing bondholders. When the Fed raises rates, bond prices fall. The longer the maturity, the larger the price swing -- which is what investors mean by “duration risk.”
What the yield curve tells you
The yield curve plots the yields of bonds at different maturities, from 3 months to 30 years. As of June 1, 2026, per StreetStats data:
Maturity Yield 3-month 3.71% 2-year 4.04% 5-year 4.17% 10-year 4.46% 30-year 4.98%
This is a “normal” upward-sloping curve -- longer maturities pay more. The 10-year vs 2-year spread is currently around +42 basis points (positive). This matters: when short-term yields rise above long-term yields, the curve “inverts” -- and that has historically preceded every US recession in the modern era. The curve was deeply inverted from July 2022 through late 2024 (the longest inversion on record at roughly 26-28 months, per Reuters), and has only recently returned to positive territory.
What “the Fed rate” actually is
When the Fed raises or cuts rates, it is specifically setting the federal funds rate -- the overnight rate at which banks lend to each other. This rate directly anchors the short end of the yield curve (3-month, 2-year). The long end (10-year, 30-year) is set by the market -- by millions of global investors collectively deciding what inflation, growth, and risk look like over a decade. The Fed influences the long end through expectations and policy signals, but does not control it. This distinction is important: the Fed can cut rates while 10-year yields rise, if the market is pricing in higher long-run inflation. This has happened.
Credit spreads: The risk thermometer
When investors buy a corporate bond instead of a Treasury, they demand extra yield to compensate for default risk. This extra yield is called a “spread.” When the economy wobbles, spreads widen -- investors demand more compensation for the risk. High-yield spreads blowing out before stock markets price in stress is a classic leading indicator of tightening financial conditions.
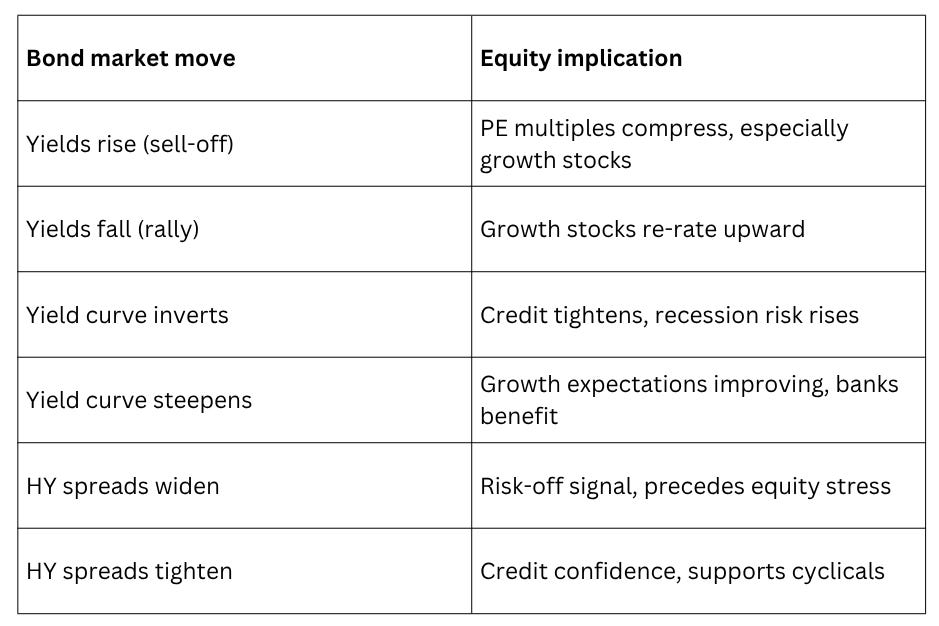
📡 How bond markets actually move your stocks
The bond market doesn’t stay in the bond market. It flows into equities, currencies, housing, and corporate earnings in predictable ways.
The discount rate channel -- the most direct
Every stock’s fair value is, in theory, the present value of all future earnings, discounted at some rate. That discount rate is anchored to the risk-free rate -- the 10-year Treasury yield. When yields rise, the discount rate rises. The future earnings of a company, which are fixed in dollar terms, are worth less today when discounted at a higher rate. This mechanically compresses stock valuations -- especially for growth stocks, which promise earnings far into the future.
This is why a 0.1% move in the 10-year yield can move the Nasdaq by 1-2%. It’s not sentiment -- it’s arithmetic. The Nasdaq, heavy with long-duration tech names, is structurally more sensitive to yields than the Dow, which is full of near-term earnings generators.
The borrowing cost channel
Companies borrow money to invest, hire, and expand. When bond yields rise, so do corporate borrowing costs. This crimps investment, squeezes margins, and -- if rates rise high enough -- makes debt-heavy companies struggle to service their obligations. Private equity, real estate, and leveraged buyout activity all depend on affordable debt. When bonds sell off, these sectors feel it first.
The “competition for capital” channel
At 4.46%, the 10-year Treasury now offers a genuinely competitive risk-free return. Ten years ago, it was below 2%. When investors can get 4.5% with zero credit risk from the US government, the premium required to hold equities (the “equity risk premium”) comes under pressure. Money rotates from stocks to bonds. Price-earnings multiples compress.
The currency channel
Higher US yields attract global capital seeking that return. That demand for dollars pushes the dollar up. A stronger dollar: compresses S&P 500 earnings (most large-caps earn significantly outside the US); reduces the competitiveness of US exports; and is deflationary at the margins. When yields fall and the dollar weakens, the reverse happens.
Illustrative framework. Not investment advice.
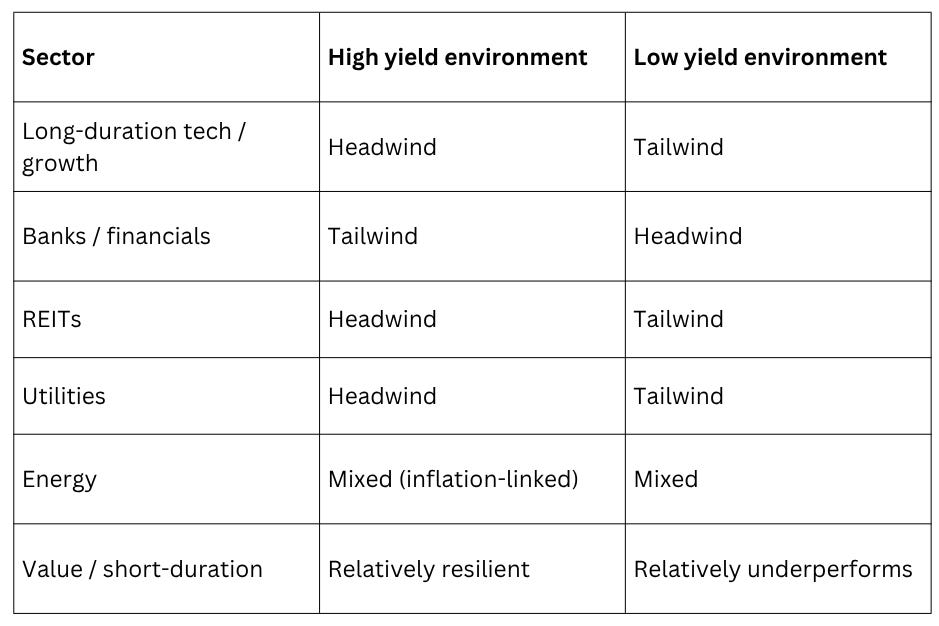
🏆 Winners and losers when yields are high -- the sector map

Not all stocks respond the same way to where the 10-year yield sits. With yields elevated above 4.4%, the sector implications are concrete.
Sectors that struggle in a high-yield world
Growth and technology stocks with high price-earnings multiples carry the most duration risk. The present-value mathematics of long-duration earnings streams is brutal when the discount rate is 4.5% rather than 1.5%. This is why the Nasdaq’s multi-year bull run has been partially interrupted by yield spikes, and why any sustained move toward 5% yields would put serious pressure on premium-multiple tech names.
Real estate investment trusts (REITs) are directly squeezed -- they rely on cheap debt to operate and compete directly with Treasury yields for income-seeking investors. At 4.5%, a Treasury beats the dividend yield of most REITs without any property market risk.
Utilities, typically defensive income plays, face similar logic. Their regulated revenues are stable but bond-like. When the risk-free rate rises, utilities’ relative appeal diminishes.
Sectors that hold up -- or benefit
Financials, particularly banks, benefit from a steep yield curve. Banks borrow short (deposits at lower rates) and lend long (mortgages and business loans at higher rates). The wider the spread between short and long rates, the better their net interest margins. The current steepening from last year’s inversion is a genuine tailwind for bank earnings.
Energy companies tend to benefit from higher-for-longer environments because the same conditions (sticky inflation, supply constraints) that keep yields elevated also keep commodity prices elevated. Oil and gas cash flows don’t depend on rate-sensitive multiples the way tech earnings do.
Short-duration value stocks -- companies trading at low price-earnings multiples with near-term earnings -- are structurally less exposed to yield changes than long-duration growth names. When yields are high, the market rewards companies paying now over companies promising to pay later.
Illustrative framework. Not investment advice.
🇮🇳 What this means for an Indian investor holding US equities
For Indian investors accessing US markets through platforms like Winvesta, the bond market adds a layer of complexity that is easy to overlook but consequential in practice.
The currency dimension
When US yields rise, global capital flows toward dollar-denominated assets to capture that return. This demand strengthens the dollar. A stronger dollar means the rupee weakens. For Indian investors converting rupees to dollars to buy US equities, a stronger dollar means your purchasing power goes further at entry -- but when you eventually sell and convert back, the dollar needs to remain strong (or strengthen further) for you to receive a full return in rupee terms.
The reverse also holds: when yields fall, and the dollar weakens, Indian investors’ rupee-denominated returns compress even if the underlying US stocks are rising in dollar terms. This is the currency drag discussed in our dollar dominance edition -- and yield differentials between the Fed and other central banks are one of its primary drivers.
The equity composition of what you own
If you hold a broad US equity index fund, you are more yield-sensitive than you may realise. The S&P 500’s Information Technology sector alone commands approximately 30% of the index, per S&P Dow Jones Indices data as of early 2026. These long-duration names are most sensitive to yield moves. When the 10-year rises from 4.5% to 5%, index-level drawdowns are not evenly distributed -- the tech-heavy portion absorbs a disproportionate share.
The Fed rate decision timeline
The Fed is currently holding rates steady. Its new chair, Kevin Warsh -- historically a hawk known for favouring higher rates, though he has recently shifted toward a more accommodative stance -- faces persistent inflation (CPI at 3.8% and PCE at 3.8% year-on-year in April, per BLS and BEA respectively) and strong jobs data that have kept cuts off the table. Some analysts, including JPMorgan, see rates on hold through end of 2026 or even the possibility of hikes if inflation re-accelerates. Rate futures show markets pricing cuts no earlier than Q3-Q4 2026 at the earliest. Each piece of US economic data -- including Friday’s jobs report -- moves those expectations and, with them, the short end of the yield curve. Indian investors who understand this mechanism can anticipate portfolio moves rather than react to them.
The carry trade context
India’s own bond market and the Reserve Bank of India’s policy rate matter here too. The spread between Indian government bond yields (currently in the 6.5-7% range) and US Treasury yields affects the attractiveness of the rupee as a carry trade destination. When US yields are high, the relative appeal of rupee assets narrows, which can pressure the currency and reduce foreign institutional inflows into Indian markets. This is a channel through which US bond market moves reach Indian equity and currency markets, often within days.
🧭 What to watch, signals that actually matter

The 10-year Treasury yield
This is the single most-watched number in global markets. A sustained move above 4.75-5% would put genuine pressure on equity multiples. A break below 4% would signal either economic deterioration (the “bad” cut) or a genuine inflation victory (the “good” cut). Currently sitting around 4.46%. Watch this number the way you watch the Nifty50.
Friday’s nonfarm payrolls report (June 6, 2026)
This is the most consequential scheduled data release of the month. A strong number (200k+ jobs, low unemployment) keeps the Fed on hold and supports higher-for-longer yields. A weak number (below 100k, rising unemployment) opens the door for cuts and sends yields lower -- which would likely be a tailwind for equities, at least initially. In a significant surprise print, this report can move 10-year yields by 10-20 basis points in a single session.
The yield curve slope (10-year minus 2-year)
Currently around +42 basis points -- just turned positive after a historically long inversion. If this spread continues steepening (long yields rising faster than short yields), it signals improving growth expectations and is generally equity-positive. If it re-inverts, recession risk is rising again.
High-yield credit spreads
When the HY spread over Treasuries starts widening meaningfully (above 400 basis points is a traditional stress threshold), it tells you credit markets are pricing in stress before equity markets have fully priced it in. This is a leading indicator worth watching alongside the yield curve.
Fed minutes and FOMC commentary
The next FOMC meeting is June 16-17, 2026 -- Kevin Warsh’s first as chair. Markets are currently not pricing in a cut at that meeting. But every piece of language from Fed officials before and after the meeting adjusts rate expectations -- and with them, yields and equity valuations.
JOLTS job openings data
Released Tuesday this week, JOLTS showed US job openings climbing in April to their highest level in nearly two years, per Trading Economics. That print reinforces the Fed-on-hold view and nudged yields higher. Data points like this are how the bond market “talks” to equity investors before the official decisions arrive.
If this changed how you see the bond market’s role in your portfolio, pass it on.
🏁 The bottom line
The bond market is not a specialist corner of finance. It is the foundation on which every other asset price is built. Every stock’s valuation, every company’s borrowing cost, every central bank’s room to manoeuvre, and every rupee-dollar exchange rate move has a bond market mechanism underneath it.
Understanding bonds doesn’t require becoming a fixed-income trader. It requires internalising three things.
First: yields and prices move in opposite directions, and higher yields compress stock multiples -- especially for long-duration growth names.
Second: the yield curve is the most reliable macro signal available. Its shape tells you where the market thinks the economy is going. An inversion warns of recession. A steepening often signals recovery. The current shape (+42 basis points on the 10-2 spread) is cautiously constructive but not emphatically positive.
Third: for Indian investors in US equities, yield moves don’t just affect stock prices in dollars. They affect the dollar itself, which affects your rupee-denominated returns in either direction. Yield differentials between the US and India drive capital flows, currency moves, and the relative attractiveness of the two markets simultaneously.
The bond market runs in the background of every investment conversation. The investors who understand it aren’t just better informed -- they’re better prepared for the moments when it moves violently, which it does, on data releases like the one coming Friday. Being ready for that is the edge.
Disclaimer: All content provided by Winvesta India Technologies Ltd. is for informational and educational purposes only and is not meant to represent trade or investment recommendations. Remember, your capital is at risk. Terms & Conditions apply.