


Most investors track the S&P 500 daily without realising that a number they barely glance at, the 10-year US Treasury yield, is quietly setting the price of everything in their portfolio. The 10-year yield just hit 4.6%, its highest sustained level since before the 2008 financial crisis, the 30-year briefly crossed 5%, and a new Fed chair just walked into Eccles Building with a mandate to fight inflation harder than his predecessor.
Every one of those facts is a direct input into what your US stocks are worth. That’s why we built Winvesta Crisps -- to break down what’s actually moving markets, in plain language, before the consensus catches up. 60,000+ investors from all over India are already in. What about you?
🔔 Don’t miss out!
Add winvestacrisps@substack.com to your email list so our updates never land in spam.
Most investors who own US stocks can tell you what the S&P 500 did yesterday. Very few can explain why a bond auction in Washington moved their tech portfolio by 2% the same afternoon.
That’s the gap this article closes.
The US Treasury market is the largest, most liquid bond market on earth -- over $39 trillion in outstanding debt, per US Treasury data. It’s the baseline that prices corporate loans, mortgages, startup valuations, and every discounted cash flow model that determines what a stock is worth. When Treasury yields move, nothing in finance is untouched.
Right now, in late May 2026, that market is sending signals that are difficult to ignore. The 10-year yield sits around 4.5%, having touched 4.67% last week -- its highest level in well over a year. The 30-year briefly crossed 5%. A new Federal Reserve chair, Kevin Warsh, was sworn in just days ago, confirmed by the narrowest Senate vote in the institution’s modern history, with a mandate that markets are still figuring out. And the US fiscal deficit is running at approximately $1.9 trillion for FY 2026, with the One Big Beautiful Bill Act projected to add $3.4 trillion or more to the 10-year debt outlook, per the CBO’s final estimate.
If you own a US equity index fund, a handful of tech stocks, or any broad ETF, the bond market is not background noise. It is the room your investments live in. Here is how it works, why it matters right now, and what to do with that knowledge as an Indian investor with rupees on the line.
🏛️ What Treasury bonds actually are -- and why they matter

When the US government spends more than it collects in taxes — which it has done every year since FY 2001, the last time the federal budget was in surplus — it fills the gap by borrowing. It does this by issuing Treasury bonds: IOUs that pay a fixed rate of interest and return the principal at maturity. Bills mature in under a year. Notes in 2 to 10 years. Bonds in 20 to 30 years.
Investors—pension funds, central banks, insurance companies, hedge funds, and millions of individuals—buy these in the open market. The interest rate they demand to hold these bonds is called the yield.
Here is the mechanic that trips most people up: bond prices and yields move in opposite directions. When investors are happy to own Treasuries, they bid up prices, and yields fall. When they’re nervous -- about inflation, about fiscal deficits, about policy uncertainty -- they demand more return to hold them, selling pushes prices down, and yields rise.
The 10-year Treasury yield is the single most watched number in global finance because it functions as the “risk-free rate” -- the baseline return you can earn with zero credit risk. Every other return in the financial system is priced off this number. Corporate bonds yield more because companies can default. Equities must offer higher expected returns still, because they carry the most risk. Change the baseline, and you change the pricing of everything above it.
That’s why a Treasury auction that goes badly -- meaning investors demand higher yields than expected -- can ripple into tech stocks within the same trading session. You’re not watching two separate markets. You’re watching one pricing system with many outputs.
⚙️ How rising yields actually move stock prices - the mechanics
There are three channels through which rising bond yields hurt stocks. Understanding all three explains why a move from 4.0% to 4.6% on the 10-year -- which sounds small -- matters enormously.
Channel 1: The discount rate channel
Every stock is, in theory, worth the present value of all the cash it will generate in the future. To calculate that present value, analysts use a discount rate -- and the 10-year Treasury yield is a core input into that rate. When yields rise, the discount rate rises with it. Future cash flows are worth less today. The higher the yield, the lower the present value -- and therefore the lower the “fair value” of the stock.
This effect is most brutal for growth stocks -- companies whose value is concentrated in profits projected 5, 10, or 15 years from now. A 1 percentage point rise in the discount rate compresses valuations significantly more for a company whose earnings are mostly in the future than for one generating cash today. That is why, every time yields spike, high-multiple tech names take the largest hit. Their valuations are most sensitive to the rate used to discount future earnings.
Channel 2: The equity risk premium channel
There’s a concept called the equity risk premium—the extra return stocks must offer over safe government bonds to compensate investors for taking on equity risk. Historically, the earnings yield of the S&P 500 (essentially the inverse of the P/E ratio) has been meaningfully higher than the 10-year Treasury yield, compensating investors for the volatility and uncertainty of owning stocks.
When yields rise, this gap narrows. As of late May 2026, with the 10-year at around 4.5% and the S&P 500 forward earnings yield at roughly 4.8%, the equity risk premium is historically thin -- meaning stocks barely offer more return than government bonds, per analysis from InvestorPlace and several Wall Street research teams. At that level, the argument for taking equity risk over simply owning Treasuries weakens. If yields push meaningfully above 5%, that calculation tips further -- and institutional money starts rotating out of equities into bonds, compressing equity prices.
Channel 3: The borrowing cost channel
Higher Treasury yields don’t stay in the bond market. They raise the cost of every form of credit in the economy. Corporate bonds, leveraged loans, mortgages, and revolving credit facilities are all priced at a spread over Treasuries. When the baseline rises, borrowing costs rise across the board.
For companies that carry significant debt -- and most large US corporations do -- this increases interest expense, compressing earnings. For companies that need to refinance existing debt, it raises the cost of doing so. For leveraged buyout activity and private equity, it makes deals harder to pencil out. And for consumers paying variable-rate mortgages or credit card bills, it squeezes disposable income -- which flows through to the revenues of consumer-facing businesses.
Higher yields are, in short, a tightening of financial conditions even without the Fed moving the overnight rate at all. The bond market tightens on its own -- and everything priced off it adjusts.
📉 Why yields are rising right now -- the three forces converging

The 10-year Treasury yield doesn’t move in a vacuum. The current rise -- from around 3.9% at the 52-week low to 4.6% in mid-May 2026 -- is being driven by three forces that are reinforcing each other.
1. The fiscal reckoning from the One Big Beautiful Bill
The US government is running a deficit of approximately $1.9 trillion for fiscal year 2026, per the Congressional Budget Office’s February 2026 outlook. The One Big Beautiful Bill Act, signed into law in July 2025, raised the debt ceiling to $41.1 trillion and is projected to add $3.4 trillion or more to the 10-year deficit outlook, per the CBO’s final estimate. More debt means more Treasury supply -- more bonds that need to find buyers. When supply outpaces natural demand, the government must offer higher yields to attract buyers. This is the “bond vigilante” dynamic that was once theoretical and is now visible in every weak Treasury auction.
Interest payments on the national debt have now crossed $1 trillion annually -- a figure that was itself unimaginable a decade ago. As yields stay elevated, refinancing older debt at higher rates compounds this burden further, in a self-reinforcing loop that makes fiscal consolidation harder rather than easier.
2. The new Fed chair and the inflation stalemate
Kevin Warsh was sworn in as Federal Reserve chair on May 22, 2026 -- confirmed by a 54-45 Senate vote, the most divisive confirmation in the Fed’s modern history. He inherits, per market commentary, the highest 10-year yield of any incoming Fed chair since Alan Greenspan took over in 1987 when the 10-year was above 8%.
Warsh comes in with a reputation for monetary discipline and a priority of fighting inflation first. Markets are now pricing in a Fed that stays on hold through most of 2026, with some probability of a rate hike rather than cuts by year-end, according to Trading Economics data. This is a significant reversal from the two cuts that were priced in at the start of the year. A Fed that is unlikely to cut rates removes a key ceiling on long-term yields -- there’s less reason for bond buyers to push yields down if rate relief isn’t coming.
3. The inflation that won’t quite die
Tariff-driven goods inflation has proven stickier than expected. The US CPI, while down dramatically from its 2022 peak, remains above the Fed’s 2% target. The combination of tariff pass-through on goods prices, elevated energy costs from Middle East tension, and a still-tight labour market means the Fed cannot declare victory on inflation and pivot to cutting aggressively. That persistence keeps yields from falling.
The result is a bond market where sellers have the upper hand -- yields are being pushed higher by supply pressure, by a hawkish new Fed, and by inflation that has not fully resolved. Each factor alone would be manageable. Together, they have produced the sharpest sustained yield rise since the Liberation Day tariff shock of April 2025.
🏆 Winners, losers, and the yield sensitivity map
Not all stocks respond equally to rising yields. The sensitivity map is predictable once you understand the mechanics -- and it determines which parts of your portfolio are most exposed right now.
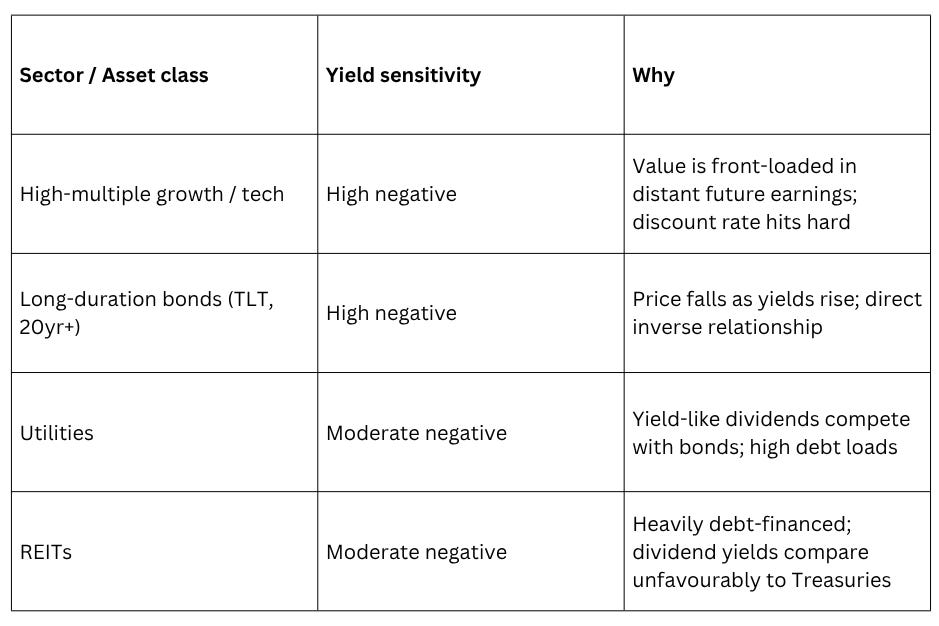
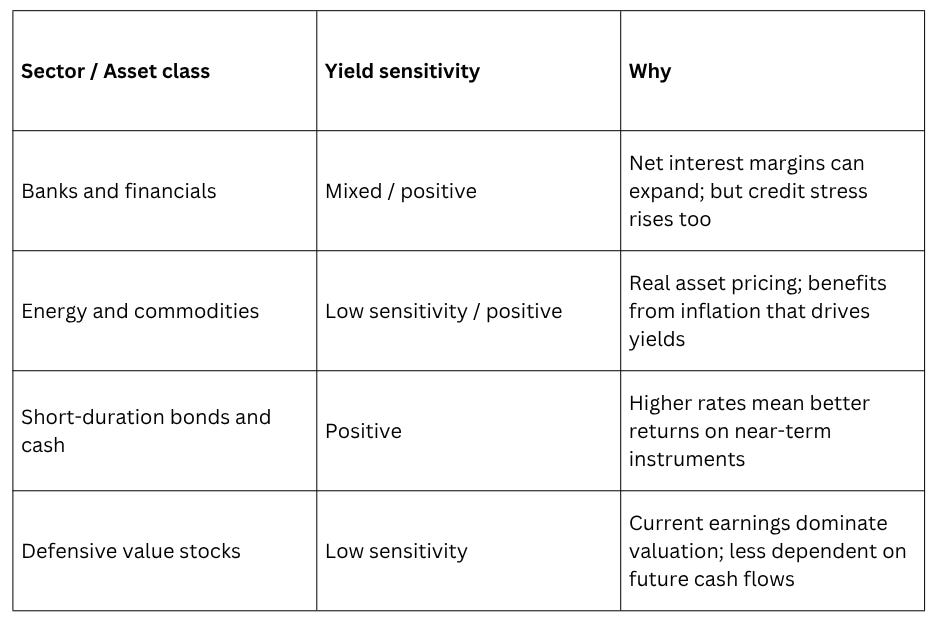
Illustrative framework. Actual sensitivity varies by company-specific factors.
The current environment is particularly challenging for the US tech sector -- which dominates most broad index funds. The Nasdaq-100, which is heavily weighted to high-multiple technology names, is structurally the most yield-sensitive major index. When the 10-year was near zero in 2021, AI-adjacent companies could justify almost any valuation on future earnings. At 4.6%, the maths is considerably less forgiving.
The flip side: financials -- particularly banks with strong domestic lending -- can benefit from a steeper yield curve, since they borrow short and lend long. And energy companies, whose revenues are linked to commodity prices that inflate alongside yields, have historically held up better in rising-rate environments.
What does this mean for an Indian investor in the US markets
For Indian investors in US equities through platforms like Winvesta, rising Treasury yields create a layered set of implications—some obvious, others less so.
Your portfolio composition matters more than you think
If your US holdings are concentrated in broad index funds like the S&P 500 or Nasdaq-100, you are, by construction, heavily exposed to the large-cap tech names that are most sensitive to rising yields. These indices are roughly 30-35% weighted to technology and AI-linked companies. That weighting has compounded returns beautifully in a low-rate world -- but it also means that a sustained rise in yields creates persistent headwind for those exact holdings. It’s not a reason to abandon index investing. It is a reason to understand what you actually own.
The currency dimension runs in both directions
Rising US yields increase the relative attractiveness of dollar-denominated assets for global investors -- which tends to support the dollar against emerging market currencies, including the rupee. A stronger dollar means your rupee buys fewer dollars when you invest, but your existing dollar-denominated holdings are worth more rupees when you convert back. In the short term, yield-driven dollar strength has historically provided a partial cushion to Indian investors during US market stress.
However, if yields rise so far that they begin to genuinely signal recession risk -- equity markets sell off sharply, the Fed eventually pivots, and the dollar weakens -- the currency tailwind reverses. This is the scenario where Indian investors face a double hit: US equity losses in dollars, compounded by dollar weakness reducing the rupee value of those holdings.
The fixed income alternative is now real
For the first time in years, US Treasuries are offering genuinely competitive returns. A 10-year Treasury at 4.5% to 4.6%, denominated in dollars, is a real yield option -- not just a defensive parking space. For Indian investors with a multi-year dollar-denominated savings goal, or those wanting to diversify away from pure equity risk, Treasury ETFs (accessible through Winvesta) now represent a meaningful alternative that did not exist when rates were near zero.
Indian IT’s indirect exposure
The bond market stress feeds into Indian domestic markets through corporate capex channels. When US companies face higher borrowing costs and tighter financial conditions, technology discretionary budgets get squeezed. Indian IT services companies -- TCS, Infosys, Wipro -- generate a substantial share of revenue from US corporate clients. A sustained high-rate environment that slows US corporate spending flows directly into Indian IT order books within two to three quarters. This is a channel to track alongside your direct US equity exposure.
If this changed how you see the bond market and what it means for your portfolio, pass it on.
🧭 What to watch: The signals that actually move the needle

Most bond market coverage is noise. Here are the specific signals that actually determine whether the yield environment is getting better or worse for equity investors.
The 10-year yield itself -- and the 5% threshold
The 10-year Treasury yield is the single most important number to track. At current levels of 4.5-4.6%, stocks can still justify their valuations -- but the margin is thin. The equity risk premium has compressed to historically narrow levels. A sustained move above 5% would be a genuine inflexion point: at that level, the case for owning stocks over bonds weakens materially, and institutional rotation out of equities accelerates. The 30-year Treasury has already crossed 5% briefly -- watch whether the 10-year follows and holds above it.
Treasury auction results
Every week, the US Treasury auctions fresh debt to fund the deficit. The bid-to-cover ratio (demand relative to supply) and the “tail” (how much higher the clearing yield is than expected) are real-time reads on whether the world is still happy to fund US deficits. Weak auctions -- like the weak 20-year auction that spooked markets in early 2026 -- are early warnings that the supply/demand balance is deteriorating. Strong auctions with low tails signal the opposite. These results move markets immediately and are worth tracking monthly.
PCE inflation data
The Fed’s preferred inflation gauge is the Personal Consumption Expenditures (PCE) index. When PCE stays above 2.5-3% -- especially the core reading that strips out food and energy -- it reduces the probability of rate cuts and keeps yields elevated. The upcoming PCE release is one of the most-watched data points in the current environment. A surprise to the upside accelerates the high-for-longer yield story; a cool reading gives markets relief.
Fed chair communication under Warsh
Warsh has signalled a desire for a more streamlined, less communicative Fed. Markets are accustomed to extensive forward guidance and press conferences under Powell. Less communication means more uncertainty -- and uncertainty commands a “term premium” that keeps long yields elevated even when the path of short-term rates is unchanged. Watch how FOMC meeting statements evolve, and whether the number of press conferences and speeches reduces under the new regime.
The 10-2 year yield spread (yield curve shape)
The spread between the 10-year and 2-year Treasury yield tells you about market expectations for growth versus inflation. As of late May 2026, with the 10-year at ~4.5% and the 2-year at ~4.1%, the curve is “steepening” from its previously inverted state -- which historically signals that recession risk is being priced in as markets expect the Fed will eventually need to cut short rates. A continued steepening of this kind is a warning that bond markets are beginning to price deteriorating growth expectations.
🏁 The bottom line
The bond market is not a separate world that fixed-income specialists worry about while equity investors focus on earnings. It is the foundation that prices everything else. When the 10-year Treasury yield rises, it raises the discount rate on every stock, compresses the equity risk premium, tightens borrowing costs across the economy, and shifts the relative attractiveness of stocks versus bonds. Every one of those effects is working against equity valuations right now.
The three forces driving yields higher -- a record fiscal deficit being amplified by the OBBBA, a new hawkish Fed chair with a mandate to prioritise inflation, and tariff-driven price pressures that haven’t fully resolved -- are not temporary noise. They are structural inputs that will shape the investment environment for the next 12 to 18 months.
None of this means US equities are about to collapse. AI-driven earnings growth is a real counterforce that has supported tech valuations even in a higher-rate environment. Companies with genuine pricing power and current earnings generation hold up far better than those whose value depends entirely on distant future cash flows. And if inflation surprises to the downside or geopolitical risk fades, yields could retrace quickly.
But understanding the bond market -- even at a basic level -- puts you ahead of most retail investors who are still asking, “Why did my tech stocks fall when the earnings were fine?” The answer is almost always: the 10-year yield moved. Now you know why that matters, and what to watch for.
The most important number in your US portfolio isn’t the S&P 500. It’s the 10-year Treasury yield. It always has been.
By the numbers 📊
~$39 trillion - outstanding US Treasury debt, making the US government bond market the largest in the world, per US Treasury data
4.5-4.6% - the 10-year Treasury yield as of late May 2026, near its highest sustained level since before the 2008 financial crisis; the 30-year briefly crossed 5%
54-45 - the Senate confirmation vote for Kevin Warsh as Fed chair on May 13, 2026, the most divisive in the Fed’s modern history
~$1.9 trillion - the projected US fiscal deficit for FY 2026, per the CBO’s February 2026 Budget and Economic Outlook, with the OBBBA projected to add $3.4 trillion or more to the 10-year deficit outlook per the CBO’s final estimate
$1 trillion+ - annual US government interest payments on its debt, now exceeding this threshold for the foreseeable future, per CBO data
~4.78% - forward earnings yield of the S&P 500 as of late May 2026, per StreetStats cited by InvestorPlace, barely above the 10-year Treasury yield; the equity risk premium is at historically thin levels
~30-35% - the estimated weight of AI and technology-linked companies in broad US equity indices, meaning most passive US index funds carry a high concentration in the most yield-sensitive stocks
Disclaimer: All content provided by Winvesta India Technologies Ltd. is for informational and educational purposes only and is not meant to represent trade or investment recommendations. Remember, your capital is at risk. Terms & Conditions apply.