

ROE-ller coaster: Riding the highs and lows of return on equity

Hey there, savvy investors! Ready to dive into the world of Return on Equity (ROE)? This financial metric might sound as exciting as watching paint dry, but trust us, it's the secret sauce that can spice up your investment strategy.
So, let's roll up our sleeves and unpack this powerhouse of profitability!

🤔 What is return on equity (ROE)?
Return on Equity is like your financial report card. It tells you how efficiently a company is using its shareholders' money to generate profits. In simpler terms, it's the bang for your investment buck!
To calculate ROE, you divide a company's net income by its shareholders' equity:
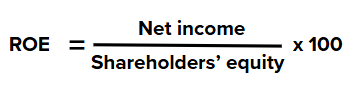
This percentage shows you how much profit a company generates with the money shareholders have invested.
📊 Calculating ROE: As easy as pie!
Let's break it down with an example. Imagine you own "Tasty Treats Inc.", a gourmet cookie company:
Net Income: $100,000
Shareholders' Equity: $500,000
Now, let's bake up that ROE:

Voila! Your cookie empire has an ROE of 20%. This means for every dollar of equity, Tasty Treats Inc. is generating 20 cents of profit. Not too crumbly!
📈 Why ROE matters: More than just a number
Understanding ROE is like having a financial superpower. Here's why it's crucial:
Profitability gauge: ROE tells you how good a company is at turning your investment into profit. It's like measuring how many cookies your bakery can make with the ingredients you bought.
Efficiency indicator: A high ROE often means the company is using its resources wisely. It's like a chef who can whip up a gourmet meal with just a few ingredients.
Growth potential: Companies with consistently high ROEs often have more room to grow. Think of it as a tree with strong roots – it has the potential to grow taller and produce more fruit.
Comparison tool: ROE helps you compare companies within the same industry. It's like judging a bake-off – you want to know who makes the best cookies with the same ingredients.
🏢 Industry variations: Not all ROEs are created equal

Just like you wouldn't compare apples to oranges (or in our case, cookies to cupcakes), ROE varies across industries. Let's look at some real-life examples:
Tech sector: Companies like Apple often have high ROEs due to their asset-light business models and strong brand value. In 2023, Apple's ROE was around 160%, which is like turning water into gold!
Utility sector: These companies typically have lower ROEs due to heavy regulation and capital-intensive operations. For instance, NextEra Energy had an ROE of about 14% in 2023. It's not as flashy as Apple, but it's still a solid performance for the industry.
Retail sector: Retailers like Walmart often have moderate ROEs. Walmart's ROE in 2023 was about 18%, which is like consistently baking a perfectly good batch of cookies – not mind-blowing, but reliable.
💡 Real-world example: Coca-Cola vs. PepsiCo
Let's compare two beverage industry giants to see how their Return on Equity (ROE) stacks up:
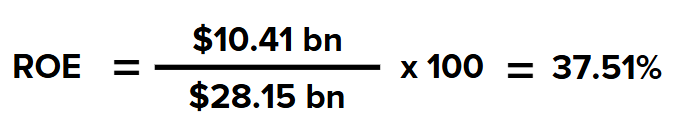
Coca-Cola (KO)
Net Income (TTM as of September 30, 2024): $10.41 billion
Shareholder's Equity: $28.15 billion
ROE calculation:

PepsiCo (PEP)
Net Income (TTM as of September 30, 2024): $9.36 billion
Shareholder's Equity: $19.61 billion
ROE calculation:


ROE analysis
Both Coca-Cola and PepsiCo are leading players in the beverage industry, but their ROE figures reveal interesting differences in their financial performance and efficiency:
Overall ROE comparison PepsiCo's ROE (48.60%) is significantly higher than Coca-Cola's (37.51%), indicating that PepsiCo is generating more profit for each dollar of shareholder equity.
Efficiency in using equity PepsiCo appears to be more efficient in using its shareholders' equity to generate profits. For every $1 of equity, PepsiCo generates about 49 cents in profit, compared to Coca-Cola's 38 cents.
Historical trends
Coca-Cola's ROE has remained relatively stable, ranging from 37.45% to 39.87% over the past year.
PepsiCo's ROE has shown more variability, ranging from 36.43% to 49.85% in the same period, but has generally trended upward.
Market capitalization vs. ROE Despite having a lower ROE, Coca-Cola has a higher market capitalization ($275.354 billion) compared to PepsiCo ($222.262 billion). This suggests that investors might be valuing factors beyond just ROE, such as brand strength or growth potential.
Revenue efficiency PepsiCo generates higher revenue ($91.471 billion) compared to Coca-Cola ($45.754 billion), yet maintains a higher ROE. This indicates that PepsiCo is more efficient in converting its revenue into profit relative to its equity base.
Industry context Both companies' ROEs are considerably higher than some of their peers in the beverage industry. For instance, Keurig Dr Pepper has an ROE of 17.28%, suggesting that both Coca-Cola and PepsiCo are outperforming in terms of generating returns on equity.
Consistency Coca-Cola shows more consistency in its ROE over recent quarters, which might appeal to investors seeking stability. PepsiCo's higher but more variable ROE might attract investors looking for potentially higher returns with some additional volatility.
Shareholder value The higher ROE of PepsiCo suggests that it's creating more value for shareholders from their investments. However, Coca-Cola's strong and stable ROE, combined with its larger market cap, indicates that it remains highly valued by investors despite the lower ROE.
📊 How to interpret ROE: Reading between the lines

Interpreting ROE is like being a financial detective. Here's your magnifying glass:
High ROE: Generally good, but watch out! It could mean the company is taking on too much debt or not reinvesting in the business. It's like a bakery that's making tons of profit but never buys new ovens.
Low ROE: Might indicate inefficiency, but could also mean the company is investing heavily in future growth. Think of a tech startup burning through cash to develop the next big thing.
Negative ROE: Usually a red flag, but not always. It could be a young company still finding its feet or a mature company going through a rough patch. It's like a restaurant having a bad year due to construction on their street.
🧿 The investor's perspective: Balancing act
As an investor, using ROE is like being a tightrope walker. You need to balance different factors:
Compare within industries: An 18% ROE might be fantastic for a utility company but mediocre for a tech startup. Why? Different industries have unique capital structures and profit margins. Utilities often have stable, regulated returns, while tech companies can scale rapidly with less capital. For example, a utility like NextEra Energy might have an ROE of 14%, which is solid for its industry. But a tech giant like Apple could have an ROE over 100%, reflecting its asset-light business model and strong brand value.
Look at trends: A consistently increasing ROE is like a rising star in the culinary world – it's promising! Trends tell a story. Is the company getting better at using its equity? Or is it a one-time spike? For instance, if a company's ROE rises from 10% to 15% over three years, it might signal improving efficiency or successful new products. But a sudden jump from 10% to 30% might raise eyebrows. Is it sustainable growth or financial engineering?
Consider the bigger picture: ROE is just one ingredient in the financial soup. Look at other metrics too, like debt levels and revenue growth. A high ROE could mask high debt levels or shrinking revenues. For example, a company might boost ROE by taking on more debt to buy back shares, reducing equity. This improves ROE but increases risk. Always pair ROE analysis with other metrics like the debt-to-equity ratio and revenue growth rate for a fuller picture.

Be wary of extremes: An unusually high ROE might be too good to be true. It could be a sign of unsustainable practices or creative accounting – like a chef using artificial flavours to make their food taste better. For instance, a company reporting a 50% ROE in an industry where 15% is the norm should prompt further investigation. Are they using aggressive accounting practices? Or have they found a truly superior business model? Remember Enron's seemingly stellar performance before its collapse – extreme numbers often hide extreme risks.

⚖️ The ROE balancing act
When building your investment portfolio, understanding ROE is crucial. It's like being a master chef creating a balanced meal. Here's how to approach it:
Know your flavour: Your investment style will determine how much weight you give to ROE. Are you a growth investor looking for high-ROE companies, or a value investor seeking undervalued gems with potential for ROE improvement?
Mix it up: Diversify your portfolio with companies showing different ROE profiles. It's like creating a buffet with various dishes to satisfy different tastes and nutritional needs.
Watch the trends: Keep an eye on how ROE changes over time. A company with a steadily increasing ROE is like a wine that gets better with age. Conversely, a declining ROE could be a red flag, signaling potential problems.
Dig deeper: High ROE doesn't always mean a good investment. A company might be boosting ROE by taking on excessive debt or buying back shares. It's like a restaurant that looks busy but is actually just moving tables around to create the illusion of popularity.
Balance with other metrics: While ROE is powerful, it's just one tool in your kit. Combine it with other metrics like P/E ratio, debt levels, and revenue growth for a more comprehensive view. It's like using multiple ingredients to create a complex, flavourful dish.
🔍 Cautions and considerations

While ROE is a powerful tool, it's not without its quirks:
Debt distortion: High debt can artificially inflate ROE. It's like using a credit card to buy expensive ingredients for your restaurant – it might look good now, but it's not sustainable.
Accounting tricks: Some companies might use creative accounting to boost their ROE. Always read the fine print!
Negative equity: When a company has more liabilities than assets, ROE becomes meaningless. It's like trying to bake a cake with negative flour – it just doesn't work.
Industry specifics: Some industries naturally have higher ROEs than others. Comparing a software company to a railroad company is like comparing apples to locomotives.
🤑 The bottom line: ROE and you
Understanding ROE is like having X-ray vision for company profitability. It helps you see beyond the flashy exterior to the financial bones of a business. Whether you're a cautious investor or a risk-taker, ROE offers valuable insights into a company's financial health and efficiency.
So go ahead, dive into those financial statements with confidence! May your investments be wise, your ROEs be high, and your returns be as satisfying as a perfectly baked chocolate chip cookie.
Disclaimer: All content provided by Winvesta India Technologies Ltd. is for informational and educational purposes only and is not meant to represent trade or investment recommendations. Remember, your capital is at risk. Terms & Conditions apply.