


Most investors have been tracking the Fed’s next move without registering how much the underlying story has changed in a matter of weeks. A new Fed chair walked in this year promising independence while the White House kept up public pressure for lower rates. Inflation spiked, then cooled sharply, then a renewed conflict in the Middle East reopened the entire argument again, all inside about ten weeks. That is exactly the kind of shift that gets lost in the daily headlines but matters enormously for anyone holding US assets from India.
That’s why we built Winvesta Crisps, to break down what’s actually moving markets, in plain language, before the consensus catches up. 60,000+ investors from all over India are already in. What about you?
🔔 Don’t miss out!
Add winvestacrisps@substack.com to your email list so our updates never land in spam.
Entering 2026, the market’s working assumption was straightforward. The Fed had been cutting rates since September 2024, bringing the federal funds rate down in stages, and traders had roughly three more cuts priced in for the year ahead. By July, that number had fallen close to zero, and for several weeks over the summer, a meaningful share of Fed officials were openly discussing a hike instead of a cut.
Ten months is roughly how long it took for “the cutting cycle continues” to flip into “no cuts, and possibly a hike.” Then, within the space of a single week in July, the story flipped again, partially, as inflation data came in far cooler than expected. This is not a one-line headline. It is a live case study in how quickly the rate outlook can move, and why building a portfolio around whichever narrative is loudest this month is a mistake most retail investors make without realising it.
🕰️ How we got here: from three cuts to zero, and back to maybe one
The rate-cutting cycle began in September 2024, and by December 2025, the federal funds rate had come down to a target range of 3.50% to 3.75%. That is where it still sits today.
The chair transition added a layer of complexity that a normal cutting cycle would not have had. In January 2026, the administration nominated Kevin Warsh, a former Fed governor, to succeed Jerome Powell. His Senate confirmation hearing in April was contentious. Warsh called for what he described as a “regime change” at the central bank and blamed the Fed for the inflation surge that followed the pandemic-era rate cuts, while also insisting that monetary policy independence is essential. He was confirmed on a narrow 51-45 vote and took office on 22 May 2026.
Warsh’s first FOMC meeting, on 16-17 June, held rates unchanged, but the accompanying dot plot told the real story. The median projection for where rates would end 2026 was revised up to 3.8%, from 3.4% in March, and nine of the eighteen officials on the committee projected at least one hike by year end. This came on the back of a May inflation print of 4.2% year on year, the highest reading in three years, driven by tariff pass-through and an energy price shock tied to the conflict between the US and Iran that had begun in late February. A strong June jobs report, with employers adding a modest number of jobs but unemployment ticking down to 4.2%, reinforced the case for staying cautious rather than cutting.
By early July, prediction markets had pushed the odds of zero Fed rate cuts for all of 2026 to roughly 80%, and Goldman Sachs had shifted its own forecast for the first cut all the way out to 2027.
Then, on 14 July, two things happened on the same day. Warsh testified before Congress and told lawmakers that the Fed’s independence is “sacrosanct,” a direct response to months of public pressure from the White House, which has at times described the Fed’s board as “hostile.” Hours later, the June CPI report landed, and it surprised almost everyone. Headline inflation fell 0.4% on the month, the sharpest monthly decline since April 2020, pulling the annual rate down to 3.5% from 4.2% in May. Core inflation, which strips out food and energy, was flat on the month and eased to 2.6% annually from 2.9%. The relief came almost entirely from falling energy and petrol prices after a ceasefire between the US and Iran earlier in June.
Treasury yields fell sharply on the news, and for a brief window, a September rate cut looked plausible again.
That window did not stay open for long. Within days, the ceasefire came under strain, the US carried out renewed strikes, and oil prices jumped to a multi-week high. By the third week of July, the 10-year Treasury yield had climbed back to around 4.55-4.60%, and futures markets were once again pricing meaningful odds of a September hike rather than a cut.
This is the whipsaw that matters. The rate outlook did not move gradually over the year. It swung from three cuts, to zero, to a possible hike, to a possible cut, to a possible hike again, largely on the back of oil prices tied to a geopolitical conflict that has nothing to do with the US domestic economy on its own terms.
⚙️ Why a few tenths of a percentage point move everything
The federal funds rate itself is a narrow, technical number. What makes it matter to every portfolio is how it transmits outward.
Treasury yields move first. When the Fed signals it will hold rates for longer, or hike, longer-dated government bond yields tend to rise in anticipation, because investors demand more compensation for holding fixed income in an environment where cash itself pays well. That 10-year Treasury yield is the reference rate used to price mortgages, corporate borrowing costs, and, critically, the discount rate applied to future corporate earnings.
That last point is where equity markets feel it directly. A stock’s value, in the simplest terms, is the sum of all the cash it is expected to generate in the future, discounted back to today. Raise the discount rate, even by a small amount, and the present value of earnings that are five or ten years away falls more than the present value of earnings arriving next quarter. This is why high-multiple growth stocks and unprofitable companies betting on distant profitability are disproportionately sensitive to a hawkish shift, while businesses generating steady cash flow today are relatively insulated.
Currency markets respond to the rate differential between countries. When the Fed holds rates higher than other major central banks are willing to, dollar assets become more attractive on a pure yield basis, which tends to keep the dollar firm. That firmness is not free for anyone converting rupees to dollars to invest, or converting dollar gains back to rupees on the way out.
Credit conditions tighten with a lag. Companies and consumers with variable-rate debt, or debt coming up for refinancing, face higher costs the longer rates stay elevated, even without a single additional hike. This is the part of “higher for longer” that gets underestimated. The damage does not require new tightening. It accumulates simply from rates staying where they are for an extended stretch, while balance sheets built for a lower-rate world roll over into a higher-rate one.
The dynamics covered in this article affect every US stock in your portfolio. Trade from India on the Winvesta app. No US bank account needed!
🚀 Join 60,000+ investors, become a paying subscriber or download the Winvesta app and fund your account to get insights like this for free!
🏆 Who wins and who is exposed in a no-cuts world
Not every asset responds to a hawkish Fed the same way. Some sectors are structurally positioned to benefit from rates staying elevated, while others carry a direct and mechanical drag.
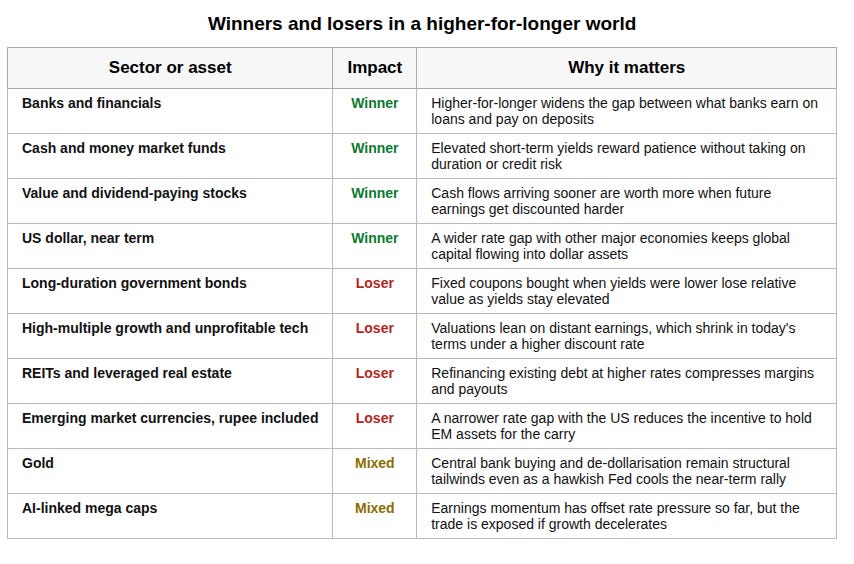
Banks and financials tend to benefit from a wider gap between what they earn on loans and what they pay out on deposits, a dynamic that improves with rates staying higher rather than falling. Cash and money market instruments reward patience directly, since short-term yields stay elevated without requiring any duration or credit risk. Value and dividend-paying businesses, whose cash flows arrive largely in the present rather than a distant future, hold up better under a higher discount rate than growth names do.
On the other side, long-duration government bonds bought when yields were lower lose relative value as new issuance carries a higher coupon. Real estate investment trusts and other heavily leveraged property vehicles face the direct cost of refinancing debt at elevated rates. Emerging market currencies, the rupee included, lose some of their carry appeal when the gap between US and local rates narrows.
Gold sits in a more complicated place. It rallied to historic highs in January 2026, partly on central bank buying and partly on fears about what a politically pressured Fed might do to the dollar’s credibility, then corrected through the first half of the year as the Fed turned more hawkish than expected. The structural drivers behind the rally have not gone away; the near-term narrative is simply fighting them.
AI-linked mega-cap technology stocks are the other name worth watching closely. So far, strong earnings growth and cloud revenue have let these companies shrug off higher discount rates in a way that would have hurt a less profitable growth trade in an earlier cycle. That resilience is not unconditional. If earnings growth decelerates while rates stay elevated, the valuation math that has been forgiving for two years stops being forgiving very quickly.
Illustrative framework based on current market dynamics. Not investment advice. Individual company and sector outcomes vary.
🇮🇳 What this means if you’re an Indian investor holding US equities
The rupee has been trading close to record lows against the dollar through July 2026, hovering around 96-97 to the dollar and down more than 11% over the past year. A Fed that holds rates steady, or hikes, tends to keep the dollar firm against most currencies, the rupee included, which works against you in two specific ways.
If you are converting fresh rupees into dollars to invest, a firmer dollar means each dollar of exposure costs you more today than it might once the rate cycle eventually turns. If you are holding US equities you plan to sell and repatriate, the currency drag compounds on top of whatever the underlying stock does, since dollar strength this year has partly offset, and at other points amplified, the returns Indian investors have actually taken home.
The Reserve Bank of India held its own repo rate at 5.25% at its June meeting, maintaining a neutral stance, and has revised its inflation forecast for the coming financial year up to around 5.1% on higher energy costs, a direct consequence of the same oil price volatility driving the Fed’s own hesitation. The RBI’s next policy decision falls in early August, just days after the Fed’s own 28-29 July meeting, which means the two central banks’ reasoning will be worth reading side by side rather than in isolation.
For bond exposure specifically, if you hold US Treasury funds or dollar-denominated fixed income through Winvesta or elsewhere, longer-duration holdings are the ones most exposed to a rate environment that stays elevated for longer than originally priced. Shorter-duration, cash-like dollar instruments are the ones actually benefiting from where rates sit today.
For equity exposure, the same valuation sensitivity that applies to US growth stocks applies to your portfolio’s composition. A portfolio concentrated in high-multiple, pre-profit growth names carries more exposure to this specific risk than one balanced with cash-generative businesses, regardless of which country you are investing from.
The oil price angle deserves separate attention, since it cuts both ways rather than pointing in one direction for Indian investors. Rising Brent crude prices, driven by the same Iran-related tensions that are complicating the Fed’s inflation read, raise India’s import bill directly and add fresh pressure on the rupee independent of anything the Fed does. This is not purely a US monetary policy story playing out an ocean away. It reaches Indian households through the same channel, petrol and diesel prices, that it reaches American ones.
If this changed how you see the Fed’s next move, pass it on.
🧭 What to watch: the signals that will actually move this
The FOMC meeting on 28-29 July is the immediate date, though most pricing currently expects a hold rather than a move in either direction. The more informative signal will be the tone of the accompanying statement and whether any officials dissent publicly in either direction.
Brent crude and the state of the US-Iran ceasefire matter more than almost any single domestic data point right now, since the entire disinflation story in June came from falling energy prices, and the entire re-acceleration in yields over the following week came from oil prices climbing back up. A durable ceasefire would remove the single biggest wildcard currently sitting inside every inflation forecast.
The July CPI report, due in mid-August, will show whether June’s sharp cooling was the start of a trend or a one-off driven by a temporary lull in energy prices. A repeat of June’s softness reopens the case for a September cut. A reversal back toward May’s 4.2% print closes that door quickly.
Jobs data carries similar weight. Another strong payrolls number keeps the hawkish case alive by removing any urgency to support growth. A visibly softer print, particularly alongside cooler inflation, is the combination that would most quickly shift the Fed’s own calculus.
Warsh’s public communication is worth watching in its own right, separate from the data. His insistence on independence in front of Congress was a deliberate signal to markets that policy will not bend to political pressure, but the pressure itself has not let up, and how he continues to navigate it will shape how much credibility markets extend to future Fed guidance.
🏁 The bottom line
The rate outlook for 2026 has moved from three expected cuts, to effectively zero, to a possible hike, to a brief reopening of cut hopes, to renewed hike odds, inside a single calendar year. Betting a portfolio heavily on whichever version of that story is dominant this week has been a losing strategy at multiple points along the way.
The practical response is not to predict the next move correctly. It is to build a portfolio that does not require a specific outcome to hold up reasonably well. That means being deliberate about duration if you hold fixed income, being honest about how much of your equity exposure depends on low discount rates holding rather than earnings growth, and treating currency as an active variable in your returns rather than something that only matters when it moves against you.
Watch oil prices and the Iran ceasefire as closely as you watch the Fed’s own statements. This year, they have been telling the same story before the Fed gets there.
By the numbers
Federal funds target range: 3.50%-3.75%, unchanged since the December 2025 cut
May 2026 CPI: 4.2% year on year, the highest reading in three years
June 2026 CPI: 3.5% year on year, the sharpest monthly decline in headline inflation since April 2020
Core CPI, June 2026: 2.6% year on year, down from 2.9% in May
Odds of zero Fed rate cuts in 2026: priced at roughly 80% by prediction markets in early July, easing modestly after the June CPI report before rebounding as oil prices climbed again
10-year US Treasury yield: around 4.55%-4.60% through mid-to-late July 2026
USD/INR: trading near 96-97, with the rupee down more than 11% over the past twelve months
Upcoming decisions: US Federal Reserve, 28-29 July 2026; Reserve Bank of India, early August 2026
All figures are directional and sourced from market data, prediction markets, and Federal Reserve and Bureau of Labor Statistics releases current as of late July 2026. Rate expectations shift with each data release and should be treated as a snapshot, not a forecast.
Disclaimer: All content provided by Winvesta India Technologies Ltd. is for informational and educational purposes only and is not meant to represent trade or investment recommendations. Remember, your capital is at risk. Terms & Conditions apply.