

Gold hit a record, then fell 25% during a war: what actually drives the price

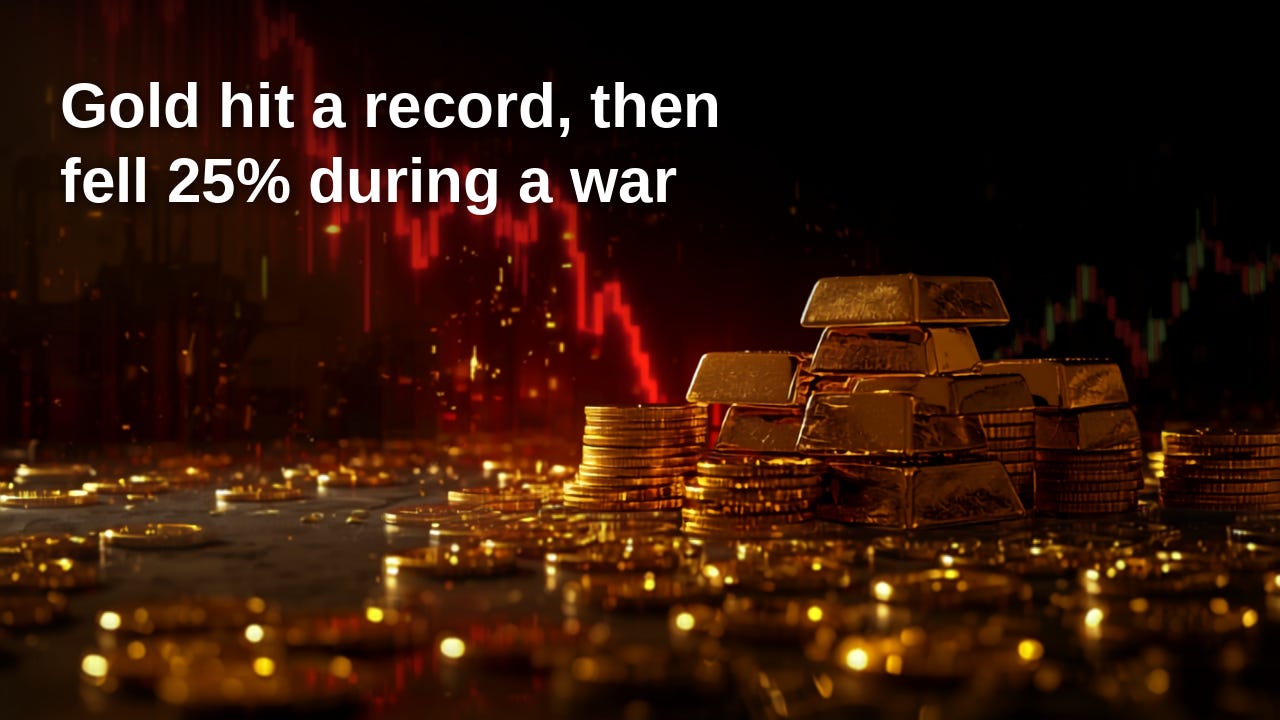
Most investors watch the gold price the way they watch the weather, as something that just happens to them. They have heard for years that gold is a hedge against war and inflation. Then, 2026 did something that broke both of those rules at once: gold set an all-time high in January, and then fell about 25% during an actual Middle East war, exactly when the textbook said it should soar. If you do not understand why that happened, you do not understand the one asset class half of India already owns. That is why we built Winvesta Crisps: to break down what is actually moving markets in plain language before the consensus catches up. 60,000+ investors from all over India are already in. What about you?
🔔 Don’t miss out!
Add winvestacrisps@substack.com to your email list so our updates never land in spam.
Gold is the most talked-about asset in the world right now, and also the most misunderstood. In a span of five months, it went from a parabolic record near $5,590 an ounce to a grinding 25% sell off, and most of the people watching it could not tell you why either move happened. The popular story that gold goes up when there is fear and inflation ran straight into a wall this year. There was a war. There was an energy shock. Inflation climbed back to its highest level in three years. And gold went down. The reason it went down is the single most useful thing a retail investor can learn about the metal, and it has direct consequences for anyone in India who owns gold in a locker, in an ETF, or is thinking about buying the dip.
From $2,600 to a record, and back down 📈

To see why 2026 is confusing, you have to see how extreme the run-up was. Gold started 2025 trading near $2,624 an ounce. It ended 2025 having returned roughly 64% on the year, setting more than fifty all-time highs along the way and breaking through the $3,000 and $4,000 barriers for the first time in history, per World Gold Council data. That alone would have made it one of the best-performing major assets of the decade.
Then January 2026 went vertical. Gold crossed $5,000 for the first time and, within the same week, printed an intraday all-time high near $5,590 an ounce on January 28, per market data. At that point, it was up roughly 27% in under a month. This was no longer a steady bull market. It was a mania, the kind of move that pulls in buyers precisely because it is rising, and the kind that rarely ends gently.
It did not end gently. A Middle East conflict involving the United States, Israel and Iran escalated through late February and into the spring. Oil spiked above $114 a barrel, and at times the market feared the near-closure of the Strait of Hormuz, the waterway that carries roughly a third of the world’s seaborne crude. This is the textbook setup for a gold explosion: war, an energy shock, a flight to safety. Instead, gold rolled over and fell about 25% from its January peak, per market analysis, drifting toward the $4,300 area, where it traded in mid-June 2026.
For most retail investors, that is the part that does not compute. War plus inflation is supposed to equal higher gold. In 2026, it equalled lower gold. The explanation is not complicated once you know where to look, and it is the difference between treating gold as a mood ring and treating it as an asset with a real engine under the hood.
The real engine behind the gold price ⚙️

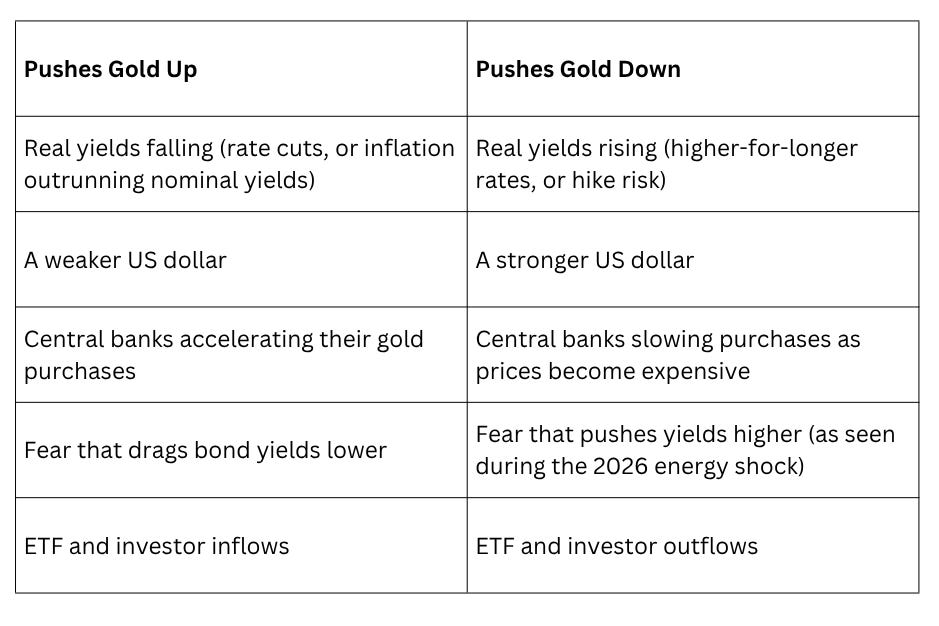
Gold pays you nothing. No dividend, no coupon, no interest. That single fact is the key to everything. Because gold has no yield, its biggest competitor is the real yield on a safe government bond, which is the interest rate after subtracting expected inflation. When that real yield rises, holding a lump of metal that pays nothing becomes more expensive, because you are giving up more guaranteed real return elsewhere. When real yields fall, gold looks more attractive. Over medium horizons, real yields are the dominant mechanical driver of the gold price, far more reliable than any headline about war or fear.
Now apply that to 2026. The energy shock pushed US inflation back up, with May CPI hitting 4.2% year on year, the highest since April 2023, driven by a roughly 23% surge in energy costs, per reported data. Normally, inflation helps gold. But this inflation came through the supply side, through oil, and that changed how the Federal Reserve was expected to respond. Rather than cutting rates to support growth, the Fed was pushed toward keeping rates higher for longer, with markets even pricing in the risk of another hike later in the year. Higher expected policy rates pulled nominal bond yields up faster than inflation expectations, which means real yields rose. Rising real yields are kryptonite for gold. The safe haven bid that should have carried gold to new records during a war was overpowered by the rate channel.
This is the lesson worth keeping. Geopolitical fear only lifts gold when it also drags yields down. In 2026, fear pushed yields higher because of energy, inflation, and the Fed. Same war, opposite effect on gold, all because of the channel it ran through.
The mechanism also explains the recent bounce. On June 14, 2026, the US and Iran reached an interim peace agreement and signalled the reopening of the Strait of Hormuz. Oil fell hard, with Brent dropping toward the low $80s. Lower oil meant lower inflation risk, which meant lower yields and a softer dollar, which removed the very pressure that had been crushing gold. Gold bounced roughly 6% off its early-June low to reclaim the $4,300 handle. The peace deal did not make gold attractive on its own. It took the boot off gold’s neck by taking down the inflation and yield risk that the war had created.
The dynamics covered in this article affect every US stock in your portfolio. Trade from India on the Winvesta app. No US bank account needed!
🚀 Join 60,000+ investors, become a paying subscriber or download the Winvesta app and fund your account to get insights like this for free!
What rises and falls with gold 🪙

Once you accept that gold is a real-yield and dollar story with a structural demand floor underneath it, the drivers sort themselves into a clean map. The table below is an illustrative framework, not a forecast, but it captures the forces that have actually been pushing the price around this cycle.
The structural demand floor is the part most retail coverage misses. Central banks have been buying gold at an extraordinary pace since 2022, the year Russia’s roughly $300 billion in foreign exchange reserves were frozen, a moment that taught every reserve manager that dollar assets held abroad can be switched off. Per World Gold Council data, central banks bought around 863 tonnes in 2025, marking the sixteenth consecutive year of net purchases and more than double the pre-2022 pace of roughly 400-500 tonnes per year. The Council projects another 750-850 tonnes in 2026. This buying is largely price-insensitive because central banks set targets, not price targets. When a country decides it wants gold to account for a certain share of its reserves, it buys whether gold is at $4,000 or $5,000. That is what puts a firmer floor under the metal than the old safe-haven framework ever did.
Two adjacent plays tend to move with gold, with more amplitude. Silver had its own record run, climbing above $120 an ounce in 2026, and gold miners behave like a leveraged bet on the metal, rising and falling harder than gold itself. Both are accessible to Indian investors through US-listed instruments, and both cut the other way just as hard when real yields turn against the trade.
What this means for an Indian investor
No asset is more personal to an Indian household than gold, and 2026 has made owning it more complicated than usual. Domestic gold crossed ₹1 lakh per 10 grams in early 2026 and has traded well above that since, even as the dollar price pulled back from its peak. That gap tells you something important: for an Indian investor, the gold return has two engines, not one. There is the dollar price of gold, and there is the rupee.
The rupee has been weak. It fell more than 7% against the dollar over the year and touched record lows near ₹95-₹96. A weaker rupee makes every dollar of gold worth more rupees, which is why domestic prices kept hitting records even while dollar gold was falling. On the way up in 2025, that same currency move quietly amplified the gold returns Indian holders earned in rupee terms. Currency is not a side note here. It is half the story.
This is also why policy got involved. To defend the rupee and conserve foreign exchange, the government raised the gold import duty from 6% to 15% on May 13, 2026, the steepest single adjustment on record, and the Prime Minister publicly appealed to households to hold off on gold purchases for a year. The World Gold Council expects Indian jewellery and bar-and-coin demand to fall by roughly 50-60 tonnes, about 10% year-on-year. For anyone buying physical gold, that 15% duty is now a direct drag on the price you pay.
That changes the calculus on how to own gold. Physical gold and domestic gold ETFs now carry the weight of the higher import duty in their pricing. US-listed gold ETFs, such as SPDR Gold Shares and iShares Gold Trust, which are accessible from India through platforms like Winvesta, give you exposure to the dollar gold price plus the rupee kicker, without the domestic import duty, though they sit under the Liberalised Remittance Scheme and carry their own US ETF and tax treatment. None of this is tax advice, and the right structure depends on your situation, but the point is that the route you choose now matters more than it did a year ago, because the duty has opened a real wedge between domestic and dollar gold.
What to watch from here 🔍

The honest picture in mid-June 2026 is a standoff. The chart is wrecked, with gold sitting below its major moving averages after the sell-off, while the structural demand story refuses to die. Which one wins depends on a short list of signals.
Real yields and the Fed are the first things to track. This week’s meeting is the first chaired by Kevin Warsh, who took office in late May, and the rate itself is widely expected to remain at 3.50%-3.75%. What matters is the path. As long as markets expect the Fed to stay higher for longer, or to hike, real yields stay elevated, and gold’s ceiling stays capped. The moment that expectation shifts toward cuts, the pressure lifts.
Oil and the peace deal's durability come next. The relief in gold and the fall in oil both rest on the Strait of Hormuz actually reopening and staying open. Energy price moves take roughly six to nine months to fully feed through into inflation, so even a confirmed reopening will not produce instant CPI relief. If the ceasefire frays, the energy-inflation-yield chain reconnects.
Central bank buying is the floor indicator. If official-sector purchases remain near the 750 to 850-tonne pace the World Gold Council projects, the downside is cushioned regardless of the chart. A meaningful slowdown would remove that support.
The dollar and the rupee close the loop for Indian investors. A weaker dollar lifts gold in dollar terms, and a weaker rupee lifts gold in rupee terms. Watch both, because your take-home return is the product of the two.
If this changed how you see gold and what actually drives the price, pass it on.
The bottom line 🏁

Gold did not fall during a war because the safe-haven logic is broken. It fell because the war ran through the energy channel, lifted inflation, kept the Fed hawkish, and pushed real yields up, and real yields beat fear every time the two collide. That is the whole lesson, and it is more useful than any price target.
For an Indian investor, the practical takeaways are concrete. Stop thinking of gold as a one-way fear trade and start watching real yields and the dollar, because those are the levers. Respect the structural floor that central bank buying provides, but do not mistake it for a guarantee of higher prices in the near term. And remember that your gold return in rupees is the dollar price times the currency, which means a weak rupee has been doing quiet work in your favour, while the new 15% import duty is now working against physical buyers. Whether this 25% pullback is your entry or a warning depends almost entirely on what real yields do next, and that is a question you can actually track rather than guess.
By the numbers 📊
Near $5,590, the intraday all-time high gold set on January 28, 2026, per market data; roughly 25% above where it trades in mid-June
~64% gold’s 2025 return, with more than fifty all-time highs along the way, per World Gold Council data
~$4,300, where gold trades in mid-June 2026, after a US-Iran peace deal eased Strait of Hormuz risk and oil fell
~863 tonnes central bank gold buying in 2025, the sixteenth straight year of net purchases and more than double the pre-2022 pace, per World Gold Council; 750 to 850 tonnes projected for 2026
4.2% US CPI in May 2026, the highest since April 2023, driven by a roughly 23% energy surge, the reason real yields stayed high
6% to 15% India’s gold import duty hike on May 13, 2026, the steepest single jump on record, was made to defend a rupee trading near record lows around ₹95 to ₹96
17.4% the BRICS+ share of global gold reserves, up from 11.2% in 2019, per industry analysis, the clearest measure of the de-dollarisation bid
Above ₹1 lakh, the level of domestic gold per 10 grams breached in early 2026, and has traded well above since, lifted by a weak rupee even as dollar gold fell
Disclaimer: All content provided by Winvesta India Technologies Ltd. is for informational and educational purposes only and is not meant to represent trade or investment recommendations. Remember, your capital is at risk. Terms & Conditions apply.