



Playing an oil shock meant reading OPEC statements and picking a barrel price direction. Not anymore. A single Strait of Hormuz headline now moves an ETF sitting quietly inside your “diversified” US portfolio, and the professional money in that exact fund has been walking out the door for three straight months even as the price sits near a 52-week high. That’s why we built Winvesta Crisps, to decode what’s actually moving the funds you own, in plain language, before the consensus catches up. 60,000+ investors from all over India are already in. What about you?
🔔 Don’t miss out! Get the latest updates delivered straight to your inbox →
Energy is the best-performing sector in the S&P 500 this year, up more than a quarter since January. The reason isn’t a demand boom or a new shale discovery. It’s a war. The US and Iran have been trading strikes on and off since February, a ceasefire signed in April collapsed, a memorandum of understanding signed in June briefly reopened the Strait of Hormuz and knocked oil down sharply, and by July that truce had broken down too. Washington has now run nine consecutive nights of airstrikes on Iranian targets, Houthi forces have threatened to blockade Red Sea shipping to Saudi Arabia, and tanker traffic through Hormuz has thinned out again. Crude is back near a five-week high.
If you own an energy ETF, that’s the good news you’ve been reading about. Here’s the part most investors haven’t seen: the same fund that’s up nearly 30% this year has been bleeding institutional money for three months straight. Retail flows into the direct oil trade are doing the opposite, rising just as the professional money is stepping back. That divergence is the story this week, not the headline price move.
Let me introduce you to someone who might be you.
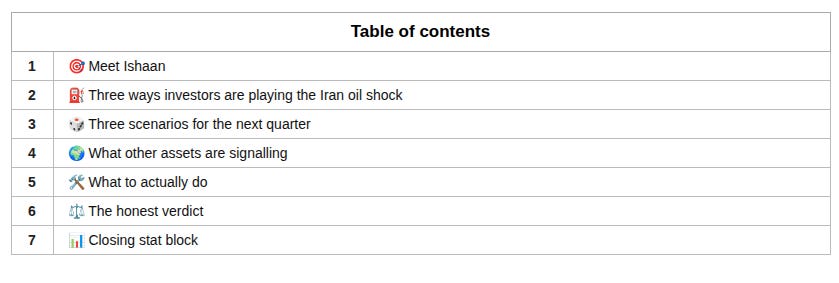
🎯 Meet Ishaan
Ishaan, 34, works in supply chain operations for a manufacturing exporter in Chennai. His US portfolio is worth approximately ₹38 lakhs: ₹13.5 lakhs in VOO, ₹9.5 lakhs in QQQ, and two energy positions he added at different points this year for different reasons.
In January 2026, with the Iran conflict already a few weeks old and oil prices choppy, Ishaan put ₹4.2 lakhs into the Energy Select Sector SPDR ETF (XLE) as what he described to himself as a “stable, value hedge” against a portfolio that otherwise leans heavily on US tech. That position is now worth roughly ₹5.4 lakhs, a gain of about 29%, broadly in line with XLE’s year-to-date move.
In mid-July, after watching oil jump on the latest round of strikes, he added ₹1.6 lakhs to the United States Oil Fund (USO), a futures-based ETF that tracks front-month WTI crude directly. That position is now worth about ₹1.7 lakhs.
Ishaan thinks of these as two different bets: a “boring” sector allocation and a “tactical” trade on the war continuing. What he hasn’t worked out is that they are largely the same bet wearing two different outfits, and together they now account for close to 19% of his US portfolio, a concentration he arrived at without ever deciding on it deliberately.
The part that should worry him more: professional money in his older, “boring” position has been quietly exiting for months. The money piling into his newer, “tactical” position is largely retail, arriving late, after most of the move has already happened.
⛽ Three ways investors are playing the Iran oil shock
For Indian investors accessing US markets, the Iran-driven oil shock shows up through three cleanly differentiated ETFs.
XLE (Energy Select Sector SPDR ETF) holds the large-cap US energy majors and refiners, including Exxon, Chevron, Valero, and Phillips 66. It’s an equity fund, so it carries earnings, dividends, and balance-sheet quality alongside the crude price. XLE is trading around $57.94, within striking distance of its 52-week high of $63.46, and is the best-performing S&P sector fund of 2026.
VDE (Vanguard Energy ETF) is the broader, more diversified cousin, holding around 111 energy names with roughly $11.8 billion in assets and a market-weight approach. It behaves similarly to XLE over time but spreads single-stock risk across a wider basket, and currently yields close to 2.7%.
USO (United States Oil Fund) skips equities entirely and tracks front-month WTI futures directly. It’s the purest, fastest way to express a view on the oil price itself, and the most punishing one to hold for long: because it has to keep rolling expiring futures contracts into new ones, USO suffers structurally from contango, a persistent drag that has left the fund down roughly 7% annualised since its 2006 inception even after a year in which the spot price of oil rose sharply.
Here’s where the fund flow data gets interesting. The table below tracks how money has actually moved into and out of XLE and USO over different windows this year. It’s directional and illustrative, built from ETF flow trackers such as ETF Database and VettaFi, not a single audited dataset, and should be verified independently before it informs any decision.
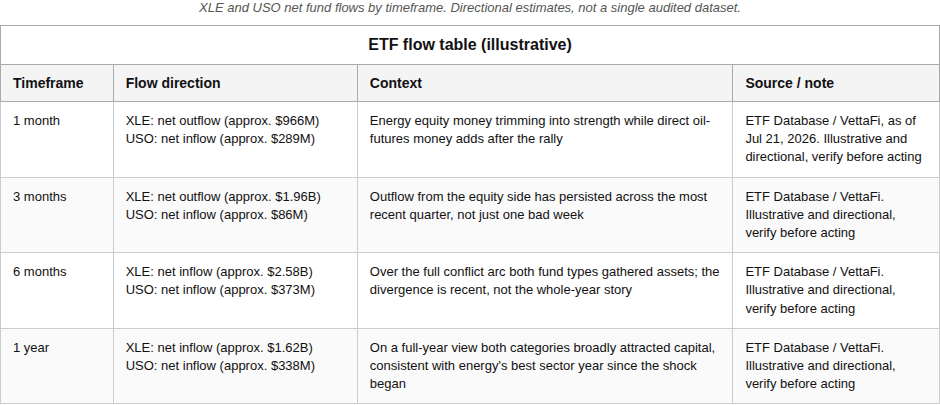
Read that table carefully and the picture is not “everyone is piling into energy.” It’s “the equity side of the trade has been quietly distributed by professional money for three months, while the futures side of the trade is where retail money is now arriving.” XLE’s price is near its highs because the war has been genuinely good for energy company earnings and refining margins. But price strength and fund flows are telling two different stories about who’s still buying.
Want to add XLE, VDE, or USO to your portfolio? Trade these ETFs directly from India on the Winvesta app. No US bank account needed!
🚀 Join 60,000+ investors, become a paying subscriber or download the Winvesta app and fund your account to get insights like this for free!
🎲 Three scenarios for the next quarter
What happens next in the Iran conflict has a direct, mechanical effect on Ishaan’s ₹7.1 lakh combined energy sleeve (XLE plus USO). The scenarios, probabilities, and return assumptions below are an illustrative editorial stress test built on assumed returns and subjective probabilities. They are not a forecast, a house view, or a guarantee of any outcome.
Scenario 1: De-escalation snapback, 25% probability Mediators succeed where the April and June attempts failed, a ceasefire actually holds this time, and Hormuz traffic normalises on a sustained basis. Gulf exporters, whose crude and condensate shipments already touched their highest level since before the war in the first half of July according to shipping-data reporting, ramp further. Oil drifts back toward the US Energy Information Administration’s own pre-escalation 3Q26 forecast of roughly $74 a barrel for Brent. XLE gives back a chunk of its war premium, falling an assumed 12% as refining margins normalise and the sector re-rates toward its pre-conflict multiple. USO, with its structural roll cost working against it even harder on the way down, falls an assumed 18%. On Ishaan’s sleeve, that’s a loss of about ₹0.96 lakhs, roughly 2.5% of his total portfolio.