

Earnings season decoded: What every number actually means for your portfolio?


Most investors watch a stock jump or crash after earnings and have no idea why. The company beat expectations, but the stock dropped 10%. The company missed, and the stock rallied. None of it makes sense until you understand how earnings season actually works — not just what the numbers say, but what they signal about the future.
That’s why we built Winvesta Crisps, to break down what’s actually moving markets, in plain language, before the consensus catches up. 60,000+ investors from all over India are already in. What about you?
🔔 Don’t miss out!
Add winvestacrisps@substack.com to your email list so our updates never land in spam.
Every three months, the world’s biggest companies open their books, and the market throws a verdict. Stocks move 10%, 15%, sometimes 20% in a single session. Investors who understood what they were looking at made decisions with clarity. Investors who didn’t were left refreshing Twitter, trying to figure out why a company that “beat earnings” was down hard.
That confusion is entirely normal — and entirely fixable. Earnings season is genuinely one of the most information-dense periods in the investment calendar. But most of the coverage is designed for people who already know the vocabulary. EPS beats, guidance cuts, revenue misses, whisper numbers — these terms get thrown around as if everyone knows what they mean and, more importantly, why they matter.
Right now, the Q1 2026 earnings season is wrapping up, and the results have been striking. According to FactSet data, 84% of S&P 500 companies have beaten EPS estimates, the highest beat rate since Q2 2021. Yet the market’s reaction has been selectively brutal: companies that missed were punished more harshly than average, among the most severe miss penalties in recent cycles. PayPal beat estimates and dropped into double digits. Netflix beat revenue and EPS targets, and still fell nearly 10% the day after. Shopify beat and dropped in the high teens.
This is earnings season in 2026. Understanding it, not just the headline numbers, but the actual mechanics, is one of the most practical things you can do as an investor right now.
🗓️ What earnings season actually is

Every public company in the US is required to file a quarterly financial report — a 10-Q — with the Securities and Exchange Commission roughly four times a year. These filings cover the three-month periods ending in March, June, September, and December. Companies report a few weeks after each quarter closes, which is why you get four concentrated windows each year — in January, April, July, and October — when hundreds of companies release results simultaneously.
That window is earnings season.
At peak intensity, around 100 major companies report every single day. Markets move on individual results but also on the aggregate picture: if most companies are beating, it signals the economy is stronger than analysts expected. If most are missing or cutting guidance, it raises red flags. For a recession, the S&P 500’s blended earnings growth rate for Q1 2026 is tracking near 27.7% year-over-year, per FactSet — and that single figure has shaped equity market sentiment for weeks.
For Indian investors accessing US markets through Winvesta, earnings season matters doubly: it drives dollar returns on your US holdings, and it shapes the macro narrative around the dollar, which determines how those returns translate back to rupees.
The four quarterly earnings seasons each year have informal nicknames based on which quarter they cover:
Q1 earnings: reported April-May, covering January to March
Q2 earnings: reported July-August, covering April to June
Q3 earnings: reported October-November, covering July to September
Q4 earnings: reported January-February, covering October to December
Q4 is often the most closely watched because it captures the critical holiday spending period and sets up the full-year narrative.
📄 How to read an earnings report: The five numbers that actually matter
An earnings report contains many numbers. Most of them are noise. Here are the five that actually move stocks — and what each one is telling you.
1. Revenue (the top line)
Revenue is the total amount of money a company brings in from selling its products or services. Also called sales or the top line. It tells you whether the business is genuinely growing, because revenue is the hardest number to manipulate — it reflects actual customer demand.
A company can engineer profit growth through cost cuts or accounting choices. It cannot engineer revenue growth. That is why a revenue beat is often more meaningful than an earnings beat alone — and why a revenue miss paired with an EPS beat is a yellow flag. Something is growing that shouldn’t need to be.
2. EPS (earnings per share)
Net profit divided by the number of shares outstanding. This is the number most financial media reports when they say a company “beat” or “missed.” Because companies have different share counts, EPS normalises profit into a per-share figure that allows comparison over time and across companies.
One important caveat: EPS can be inflated by one-time items. Netflix’s Q1 2026 EPS was significantly boosted by a multi-billion-dollar termination fee from an abandoned acquisition. Strip that out, and the underlying picture looked considerably more modest — which is exactly why the stock fell despite the headline beat.
3. Guidance
This is the number most investors don’t watch closely enough — and the one that actually drives the stock more than anything else.
Guidance is management’s forward-looking estimate for the next quarter or full year. Revenue guidance, margin guidance, EPS guidance. When a company beats last quarter’s results but cuts guidance for the next quarter, the market almost always sells it off. Because the market is forward-looking, it doesn’t care what happened between January and March. It cares what’s going to happen between April and June.
This is precisely what happened with Netflix. Beat on revenue, beat on EPS — and still fell nearly 10%, because Q2 guidance came in below analyst expectations and full-year guidance remained unchanged when investors had expected it to be raised.
4. Gross and operating margin
Margins tell you whether the company is keeping more or less of each dollar it earns. Gross margin is revenue minus direct costs. Operating margin takes out overhead, too. If revenue is rising but margins are compressing, the company may be buying growth rather than earning it — a structurally weaker signal that sophisticated investors penalise.
In a tariff-heavy environment like 2026, margin commentary has become especially important. Companies absorbing higher input costs without raising prices are margin-compressing. Companies with pricing power are passing those costs through. The margin line separates them.
5. Free cash flow
Profit is an accounting construct. Free cash flow — cash generated from operations minus capital expenditure — is real money. Companies can report profits while burning cash. The opposite is also true: a company might show modest profits but generate substantial cash, which funds buybacks, dividends, and future investment.
For long-term investors, free cash flow is often the most honest measure of a business’s underlying health. It is harder to manipulate than EPS and more revealing than revenue alone.
The dynamics covered in this article affect every US stock in your portfolio. Trade from India on the Winvesta app. No US bank account needed!
🚀 Join 60,000+ investors, become a paying subscriber or download the Winvesta app and fund your account to get insights like this for free!
🧠 The expectations game: Why a “beat” can still mean a stock falls
This is the part that confuses most retail investors — and it is the most important concept of the entire earnings season.
The stock market does not react to what a company reports. It reacts to the gap between what was reported and what was expected. Understanding that distinction changes everything.
Before a company reports, Wall Street analysts publish their estimates for revenue, EPS, and other metrics. These estimates are averaged into a consensus number — the “official” bar a company needs to clear. A result above consensus is a beat. Below is a miss.
But here is where it gets complicated.
The whisper number
Alongside the official consensus, professional investors have their own private expectations — often higher than the published number. This is what Wall Street calls the whisper number: the unofficial bar that sophisticated market participants are actually measuring a result against. A company can beat the official consensus and still disappoint if it misses the whisper number.
This is exactly what happened with NVIDIA in Q4 2024. The official consensus forecast was for a specific EPS figure. NVIDIA met it — but the whisper number among professional investors was higher, and the result landed precisely at consensus, not above it. The stock fell meaningfully in the sessions after. The market was already pricing in the whisper. The beat was fully expected.
Buy the rumour, sell the news.
When investors expect strong results, they buy the stock before the report, pushing the price up. By the time the results arrive, the good news is already reflected in the price. The actual announcement becomes a catalyst for profit-taking rather than further buying. The cleaner the beat, the more dramatic the selloff can sometimes be — because there is nothing left to surprise the market.
Guidance matters more than the quarter.
Markets are forward-looking engines. A strong quarter tells you what the business did. Guidance tells you what it is likely to do next. When those two diverge — great quarter, cautious outlook — the stock almost always follows the guidance, not the quarter.
The table below illustrates how different combinations of beat/miss and guidance tend to move stocks:
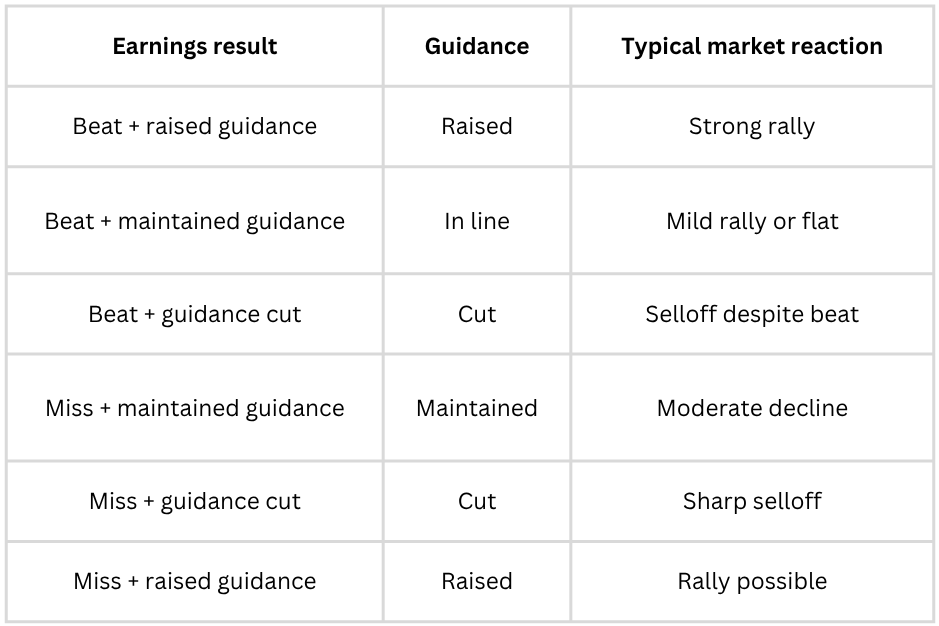
Illustrative patterns based on historical earnings reactions. Actual outcomes vary by sector, valuation, and broader market context.
🏆 Winners, losers, and what Q1 2026 is actually telling us
Q1 2026 earnings season has been one of the strongest on record by headline metrics — and one of the more punishing in terms of how markets have treated disappointment.
The headline story: Beats everywhere
With 89% of S&P 500 companies now reported, 84% have beaten EPS estimates, the highest beat rate since Q2 2021, per FactSet. The blended earnings growth rate is tracking near 27.7% year-over-year, per FactSet’s May 2026 update — on track to be the highest since Q4 2021. Revenue growth is running at 11.3%, the highest since Q2 2022. These are strong numbers by any historical standard.
But the “miss penalty” is unusually severe
Despite the broad beat rate, companies that have missed estimates are being punished at a rate not seen since mid-2025, well above the historical norm. This tells you something important about market psychology: at a forward P/E of around 21x, which is above both 5-year and 10-year averages, the market has elevated expectations baked in. There is no margin for error.
Concentration is a feature, not a bug
Most of the earnings upside is concentrated in Technology, Communication Services, and a handful of mega-cap consumer names. The “Magnificent 7” (Apple, Microsoft, Alphabet, Amazon, Meta, Tesla, NVIDIA) continue to outgrow the other 493 S&P 500 companies by a wide margin. That gap — which many analysts expected to narrow — has not narrowed. If you own a broad US index fund, you are benefiting from this concentration. You are also fully exposed to the risk if it reverses.
The tariff question lurking in every guidance call
One phrase dominated Q1 2026 earnings calls across sectors: “tariff uncertainty.” Companies with international supply chains or significant exposure to China were universally cautious in their guidance. The companies that navigated this best were those with domestic revenue concentration, genuine pricing power, and supply chains already diversified away from China. Ford is instructive here: despite reporting a headline beat, the stock still sold off as investors digested the tariff-related complexity in its margin outlook and questioned whether the beat was structurally sustainable in the future.
Sector performance diverged sharply
Per FactSet sector data, the strongest contributors to Q1 earnings growth were industrials, IT, financials, and communication services. Energy was a drag as oil prices remained under pressure. Consumer discretionary was uneven — spending was resilient in some categories, soft in others.
If this changed how you see earnings season and what’s actually moving the stocks you own, share it with your investing circle.
🇮🇳 What this means for Indian investors holding US equities

For Indian investors, earnings season is not just a US story. It reaches you through three direct channels.
Dollar returns and rupee translation
Your US equity returns are denominated in dollars. When Q1 earnings come in strong and the broader S&P 500 rallies, you benefit — but the actual rupee return depends on what the dollar is doing at the same time. A 10% gain in dollar terms, combined with a 3% dollar depreciation against the rupee, produces a 7% return when you bring that money home. Strong earnings can support the dollar, but tariff uncertainty has simultaneously been weighing on it. Currency is not separable from the earnings story.
Indian IT is the clearest earnings-season proxy
India’s listed IT sector — TCS, Infosys, Wipro, HCL Tech, Tech Mahindra — derives the majority of its revenue from US corporate clients. When US companies tighten technology discretionary budgets in response to earnings pressure or guidance uncertainty, Indian IT order books feel it, often within one to two quarters. The Q1 2026 pressure on IT discretionary spending, driven by tariff-related corporate uncertainty, has been visible in Indian IT guidance commentary this season. For investors holding Indian domestic equities alongside US names, this is an explicit cross-market link worth tracking.
Sector rotation creates opportunity
When earnings season reveals clear sector winners and losers, it creates repositioning flows that affect valuations. Defensive sectors that outperformed in Q1 — healthcare, utilities, domestic financials — saw valuations firm up. Highly tariff-exposed names de-rated. For a disciplined investor watching earnings commentary rather than just headline prices, these moves create entry points or exit flags depending on your thesis.
The LRS constraint and timing
Indian investors remitting money abroad under the Liberalised Remittance Scheme face a practical constraint: moving money in and out in reaction to every earnings cycle is costly and tax-inefficient. The right use of earnings-season intelligence is not tactical rebalancing on every report — it is building conviction about which businesses you want to hold through multiple earnings cycles, and using volatility created by short-term earnings reactions as entry opportunities, not panic signals.
🧭 What to watch during earnings season
You do not need to follow 500 companies. A few specific signals tell you most of what you need to know.
Guidance language, not just the guidance number
Management teams are measured on whether they hit their own targets, so they have an incentive to set guidance conservatively. What matters as much as the number itself is the language around it. “Strong demand environment,” “some softness in enterprise spending,” “pausing investments pending policy clarity” — these qualitative signals often reveal more than a precise revenue range. Pay particular attention to phrases like “tariff-related headwinds,” “customer elongation of decision cycles,” or “supply chain cost uncertainty.”
Revenue growth versus margin trajectory
The most durable businesses show both growing revenue and stable or expanding margins. A company that beats EPS through cost cuts while missing revenue is buying time, not building value. In a market priced at 21x forward earnings, the quality of the beat matters as much as the fact of the beat.
Concentration in the “beats”
When the overall S&P 500 beat rate is strong, but the beats are concentrated in a handful of mega-cap names, the breadth is deceptive. Watch for sector-level data from FactSet and Bloomberg: if five sectors are driving 80% of earnings growth, the index is more fragile than the headline number suggests.
The “sell the guidance” trades
When a stock that has run up significantly into earnings drops sharply after a perfectly good report, it is almost always a guidance-related or whisper-number story. Before adding to or selling a position around earnings, ask: has this stock already priced in a beat? A stock up 30-40% in the months before a report is carrying elevated expectations. The bar it needs to clear is not the consensus — it is something higher.
Earnings call tone versus press release
The press release is the sanitised version. The earnings call — specifically the Q&A — is where management tone, analyst probing, and candid commentary about the future tend to emerge. Listen for hesitation when asked about margins or demand. Watch whether management answers guidance questions directly or deflects. Directness and specificity are bullish signals. Vague, hedged answers about the next quarter are worth noting.
🏁 The bottom line
Earnings season is not about whether a company made more money than last year. It is about whether a company made more money than the market expected — and whether it looks likely to keep doing so.
That distinction seems small until you watch Netflix beat on revenue and EPS and still fall nearly 10% because the next quarter’s guidance was soft. Or Ford reports a headline beat and still sells off because the tariff math on margins didn’t hold up. Or NVIDIA report a genuine earnings beat and fall because the result confirmed what the whisper number already assumed.
The playbook that actually works for a long-term investor is this: use earnings season as a diagnostic tool, not a trading trigger. Each report tells you something about the health of the businesses you own. Guidance tells you what management is seeing in real time. Margin trends tell you whether pricing power is holding. Free cash flow tells you whether the profit is real. Put those together across multiple quarters, and you build a picture far more useful than any single headline beat or miss.
For Indian investors in US markets, the added layer is currency. Strong earnings that support the dollar amplify your rupee returns on the way up. Earnings that weaken the dollar erode them. That interplay — between US corporate results and the dollar-rupee rate — is not a reason to stay out of US equities. It is a reason to understand them more completely.
Q2 2026 earnings season kicks off in mid-July. You are now more prepared for it than most retail investors on either side of the world.
📊 By the numbers
84% — share of S&P 500 companies beating EPS estimates in Q1 2026, the highest beat rate since Q2 2021, per FactSet (as of mid-May 2026); if this holds for the full quarter, it would be the highest since Q2 2021’s 87%
~27.7% — blended year-over-year earnings growth rate for the S&P 500 in Q1 2026, per FactSet’s May 2026 update, on track to be the highest since Q4 2021
~11.3% — blended revenue growth rate for Q1 2026, the highest since Q2 2022, per FactSet
More severe than average — the miss penalty this earnings season: companies missing estimates have been punished well above historical norms, reflecting a market with elevated expectations priced in
20.9x — the S&P 500’s forward price-to-earnings ratio as of May 2026, above both the 5-year average of 19.9x and the 10-year average of 18.9x, per FactSet — meaning there is little forgiveness for disappointment
~9-10% — the drop in Netflix stock the day after its Q1 2026 earnings, despite beating revenue and EPS estimates, because Q2 guidance came in below analyst expectations
4 — the number of earnings seasons per year, in January, April, July, and October, when quarterly results are the dominant market-moving force for US equities
Disclaimer: All content provided by Winvesta India Technologies Ltd. is for informational and educational purposes only and is not meant to represent trade or investment recommendations. Remember, your capital is at risk. Terms & Conditions apply.